Bitcoin might not see $32k until October 2023. Must read

Bitcoin has not made Amy significant gains for over a month now and we've seen a lot of bulls and bears taking stances that are really extreme. For the bears, they claim this is the dead end for the wonderful pump we had in March, hoping we would have a neat flush out in the market back to around below $20k. As for the bulls, the hope and claim with funny drawings on the chart trying to back their position that #BTC would pump crazy from here to around $48k in few weeks time. In this post, I'm only going to talk about the facts in the chart and before I proceed to the charts, there's a disclaimer I need to declaim. This is not a financial advice and I'm not a financial advisor. Everything I post here are for educational purposes and I COULD BE WRONG. Before you YOLO your cash, please do your own research and be 100% sure🙂.
I'm going to make it brief and straight to the point. With the facts in the chart, Both extreme cases from the bulls and the bears
might be wrong seeing that the level at which #BTC is trading at the moment is very significant. We've been at this level twice in every first step of bull markets and bitcoin did the same thing every time, and this time might not be different.
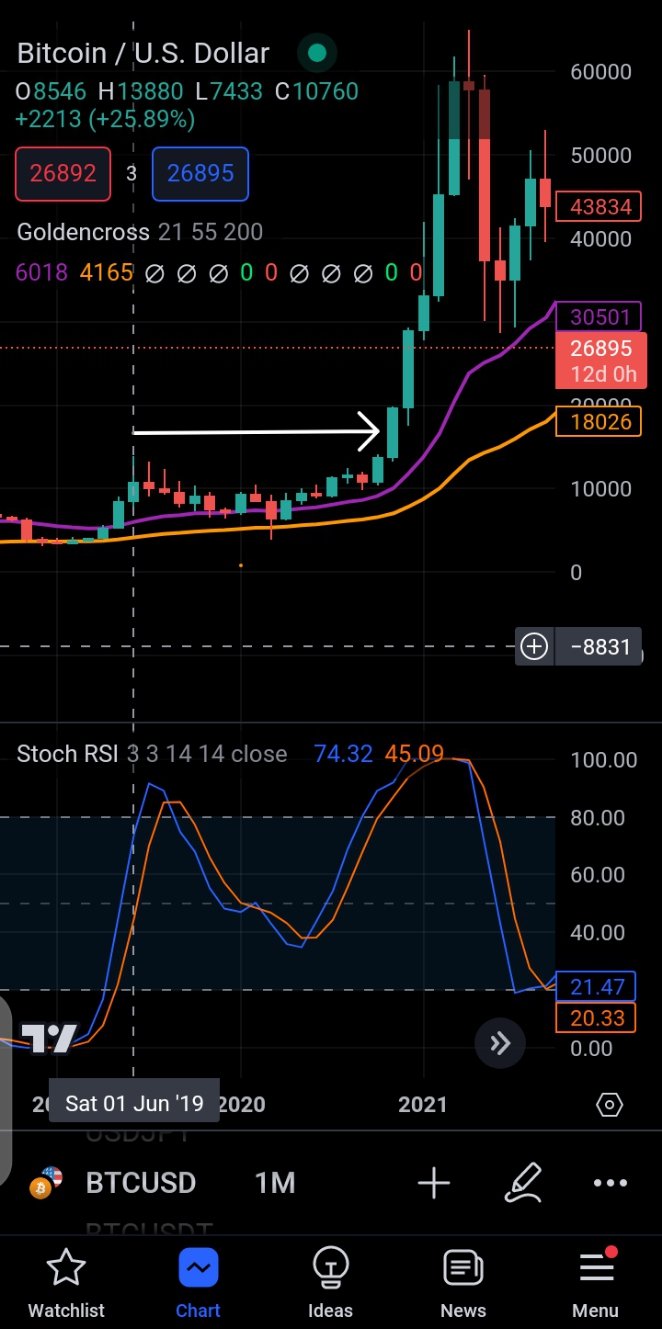
In 2019, our monthly stochastic RSI was around 70 and price popped up to around $13800, it took bitcoin 14 months to print a higher price($14100) and when that happened, the parabolic run to $68k was inbound.
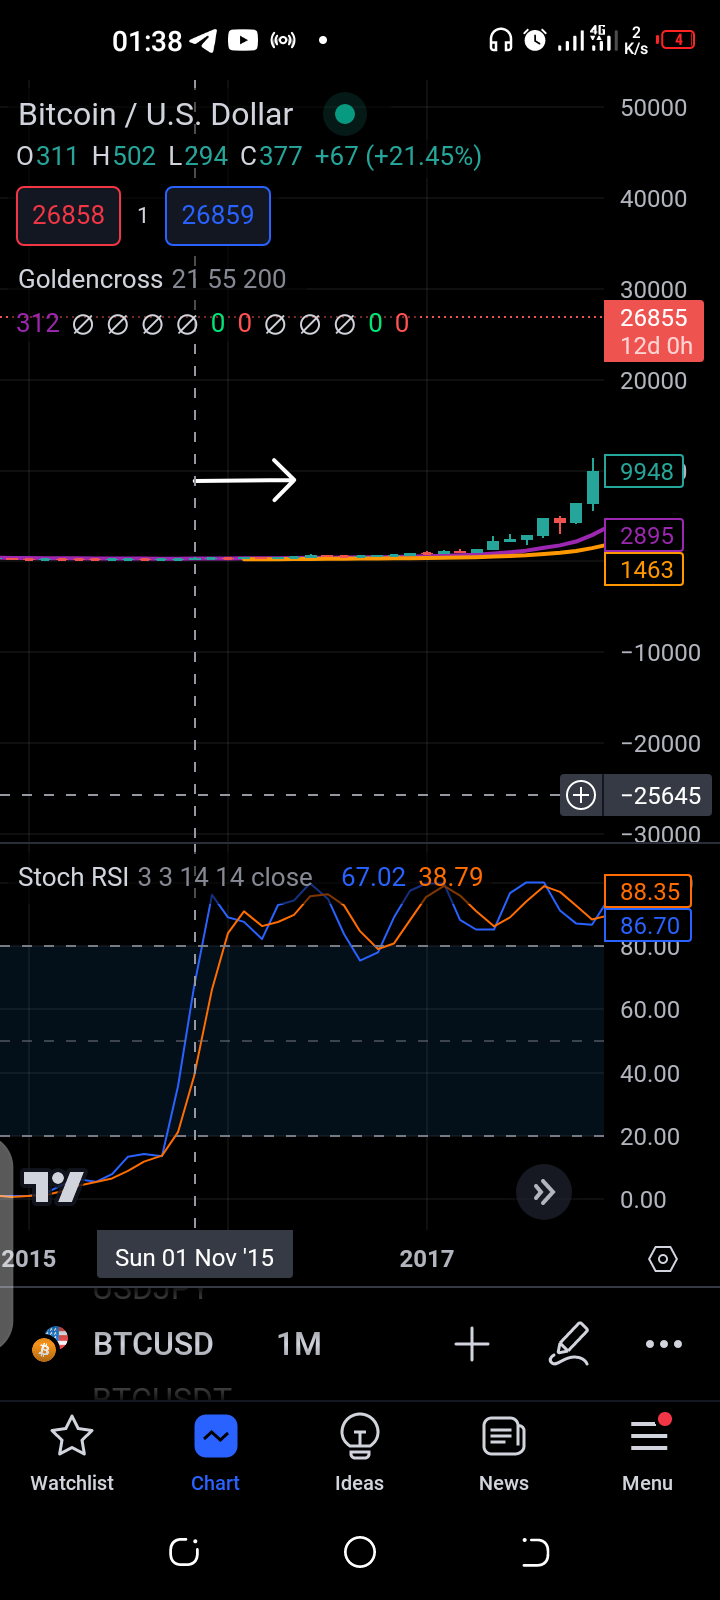
From the chart in 2023, we have come to the conclusion that 2023 is like a mirror image of what bitcoin did in 2015 pound for pound. Which makes it easier to assume what its gonna do next. In November 2015, Bitcoin printed a high of around $508 coming out of the bear market. It took it till May 2016( approximately 7 months) to print a higher price of around $550 and the rest is history.
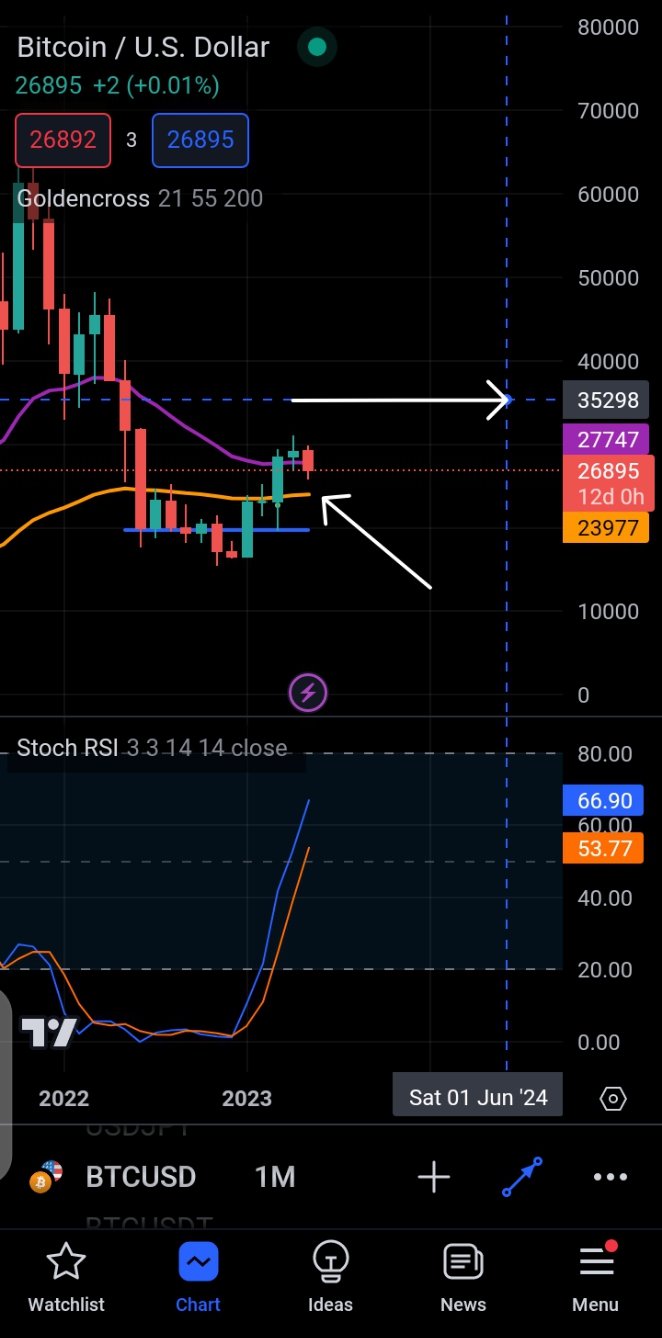
Today we got out of the bear market in March and printed a high at around $31k and since then been down. Seeing our Stochastic RSI which is our momentum around the 70 level only begs the questions... Are we at the significant level as in 2019 and 2020? Yes I think we are. Will it take 7 months( like 2015) or 14 months(like 2019) to have a higher price? I'm 98% sure we will trade sideways for a couple of months. However, since our chart looks similar to that of 2015, I'd say we can stay at this level for 7 months at most. Technically, our next higher price (above $32k) would happen at around the month of October 😦. The worst case scenario would be the 14 months, putting us around June 2024 after the bitcoin halving. This is unlikely tho😂 but it would be a painful grinding match.
In conclusion... Both cases looks good for bitcoin in the long run and the most likely is the 6-7 month sideways trading scenario for btc, accumulating for 7 months, then pump. This dormant state of btc always depict good news for Alt coins and we might see serious gains from the top 50 soon.
Do have a great week ahead. I'll catch you on the next one.
