BITCOIN: Price About To Move
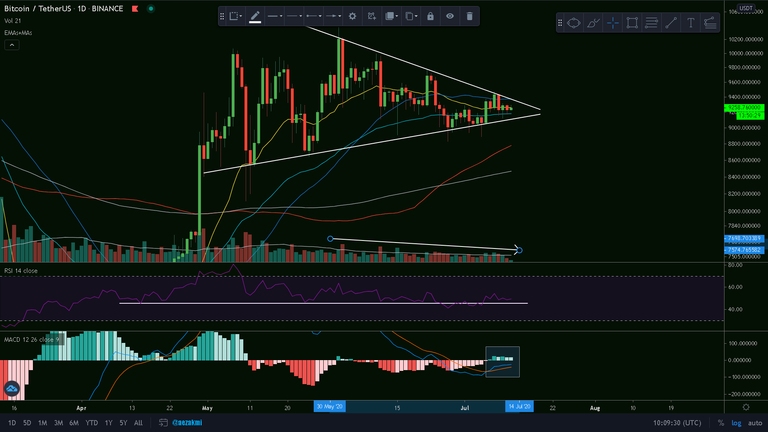
BTC/USD Daily Chart
After several attempts from the bulls and bears to break the pattern, Bitcoin has finally reached the peak of the symmetrical triangle and a breakout is about to happen. The bulls have regained the 55 day EMA (blue) and the 46 RSI support mark and are currently fighting at the 21 day EMA (yellow). However, the trading volume is still continuing to decrease and the bullish MACD cross in the negative area is weak.
Breaking to the lower side could bring as to $8500, a level that marked important S/R levels in the past and where the 200 day MA (grey) is to be found. Breaking to the upper side could mean a re-attempt for the bulls to fight the two-year-long descending trend lines, which I mentioned before.
Ctrl + Click here to enlarge the image in a new tab (steemitimages)
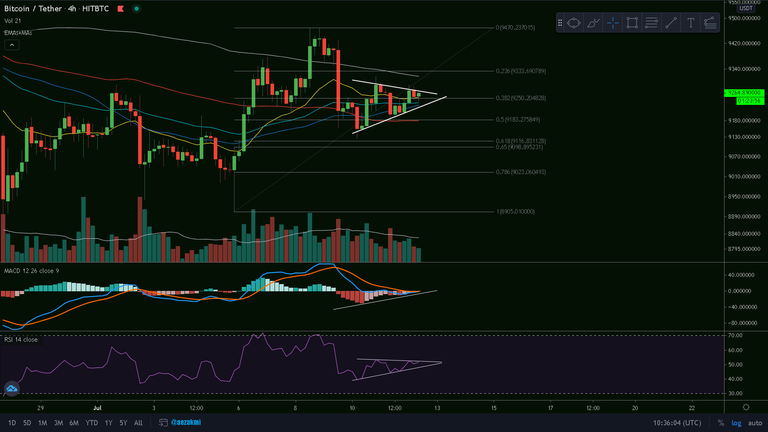
BTC/USD 4h Chart
On the 4h we also have a symmetrical triangle about to break, having the 0.382 Fibonacci retracement and the 50 MA, 55 EMA and 21 EMA as support. Furthermore, we have a bullish MACD cross about to happen, with some decent momentum.
Ctrl + Click here to enlarge the image in a new tab (steemitimages)


Thanks for reading and safe trading!✌
If you find this post useful, please:
