BTC and Hive Chart Analysis
Hello. There is a huge downtrend in the cryptocurrency market. Without exception, all cryptocurrencies are affected by this negative price pressure. I decided to share an analysis for Hive users. I will share my Bitcoin and Hive charts. Data from Tradingview site. I used weekly chart on BTC/USDT pair.
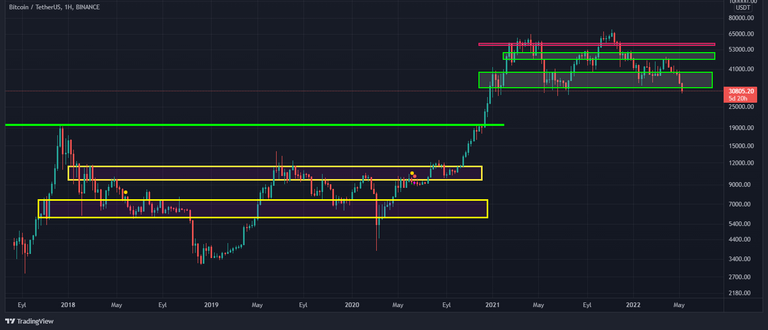
It is located in a wide supply-demand region in the price range of 39000-32000. If it can stay at $40000 and above, we can expect upside movements. However, candle closes at $32000 and below will put downward pressure on the price. Below, $20000 level is waiting for us. The next lower level is the peak in 2017.
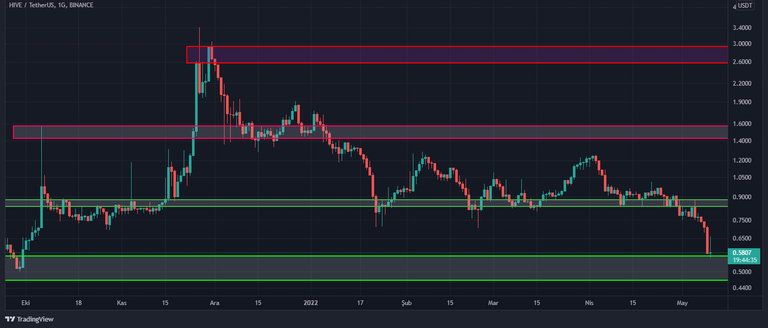
We are on the Hive/USDT chart. The data were taken from the daily chart. It is in the $0.56-0.46 price range. This is a solid supply-demand region. If the said zone is breached to the downside, we can expect prices of $0.3. On the upside movements, the $0.8 region will form a resistance. Because this region was the peak region tested in April 2020, April 2021.
I am not an investment advisor. For this reason, it will be more beneficial for you to see my graphic writings as an educational work. See you in new posts.
TR:
Merhaba. Kripto para piyasasında büyük bir düşüş trendi var. İstisnasız olarak bütün kripto paralar bu olumsuz fiyat baskısından etkileniyor. Hive kullanıcıları için bir analiz paylaşmaya karar verdim. Bitcoin ve Hive grafiklerimi paylaşacağım. Veriler Tradingview sitesinden. BTC/USDT paritesinde haftalık grafik kullandım.
39000-32000 fiyat aralığında geniş bir arz-talep bölgesinde bulunuyor. 40000$ ve üzerinde kalabilirse yukarı yönlü hareketler bekleyebiliriz. Ancak 32000$ ve altındaki mum kapanışları fiyata aşağı yönlü baskı uygulayacaktır. Daha aşağılarda 20000$ seviyesi bizleri bekliyor. sonraki alt seviye 2017 yılındaki zirve noktasıdır.
Hive/USDT grafiğindeyiz. Veriler günlük grafikten alındı. 0.56-0.46$ fiyat aralığında bulunuyor. Burası sağlam bir arz-talep bölgesidir. söz konusu bölge aşağı yönlü ihlal edilirse 0.3$ fiyatlarının bekleyebiliriz. Yukarı yönlü hareketlerde ise 0.8$ bölgesi bir direnç oluşturacaktır. Çünkü bu bölge Nisan 2020 ve Nisan 2021 tarihlerinde test edilen zirve bölgesiydi.
Ben bir yatırım danışmanı değilim. Bu nedenle grafik yazılarımı eğitici bir çalışma olarak görmeniz sizin için daha faydalı olacaktır. Yeni gönderilerde görüşmek üzere.
Posted Using LeoFinance Beta
analiz için cok sagolun hocam bende 30k altına iner mi diyorum ufak bi alım yapmak için
Eyvallah hocam. O da ihtimal dışında değil. 2018'de 19.000$ seviyelerinden 3.500 seviyelerine indi. Unutmamak lazım. Ancak bu ihtimal alım için engel değil. Kaldıraçlı işlemlerden kaçınmak lazım sadece.
It's really hard to predict which way they will move. Quite interesting things are happening right now. But my personal opinion is that this decrease will not be more.
Posted Using LeoFinance Beta
I agree. However, it is necessary to avoid guesswork for both directions. We just have to be prepared in both directions.
We have seen bear and bull markets many times and we will see many times in the future. If you are in this market, it is impossible to avoid it. That's why I think everyone in the crypto market should be ready for bear and bull markets and educate themselves in this direction.
Posted Using LeoFinance Beta
Thanks, the charts are really helpful!
I thank you. I hope it is helpful.
Yay! 🤗
Your content has been boosted with Ecency Points, by @anadolu.
Use Ecency daily to boost your growth on platform!
Support Ecency
Vote for new Proposal
Delegate HP and earn more