Hive, SPS And Leo Chart Analysis
Hello everyone. In a bull market, we look at the charts a lot. However, our interest is waning in the bear market. We don't particularly want to look at the graphics. According to human psychology, the longer the bear market lasts, the more we get bored. However, there is something we should know; Times when the majority lose interest in the market offer great opportunities for smart investors.
Today, I took a look at the price charts of cryptocurrencies on the Hive Blockchain, which I follow with interest. I made some drawings. Or edited my previous drawings. I wanted to share with you some of the graphics I follow. In this post, I will review Hive, Sps and Leo graphics. I prefer to get data from exchanges with the highest volume. I took the screenshots from Tradingview charts.
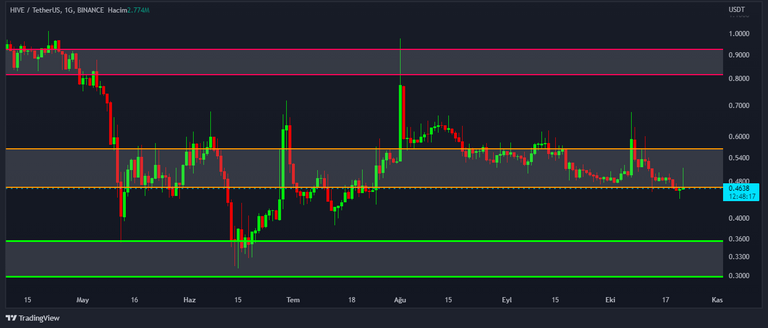
The chart above is taken from the data of the Binance exchange. Hive/USDT chart. I prefer to follow in the daily time frame. The price has been in a broad supply-demand zone since May. It is hovering around the $0.5 price, although it drops pins up or down from time to time. The supply-demand region is in the $0.46-$0.56 range. The above supply-demand zone is in the $0.8-$0.92 price range. The supply-demand zone below passes through the $0.35-$0.3 price range.
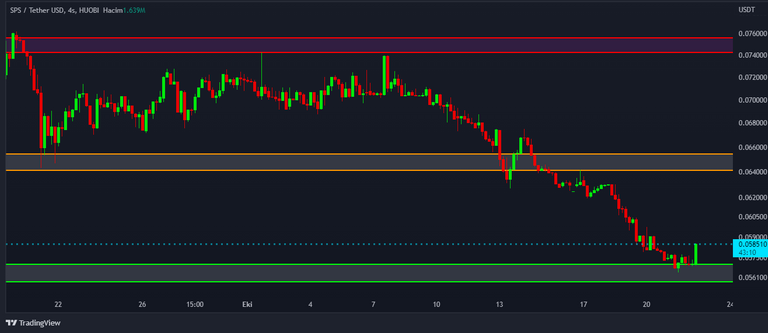
The chart above is from the Huobi exchange. Sps/Usdt chart. Since there is not enough data on the daily chart, I chose the 240 Minute time frame. There is a supply-demand zone in the $0.057-$0.055 price range. There is an upward movement. Above is a supply-demand zone in the 0.064-0.065 price range. If this region is passed, the target will be the 0.074-0.75 region.
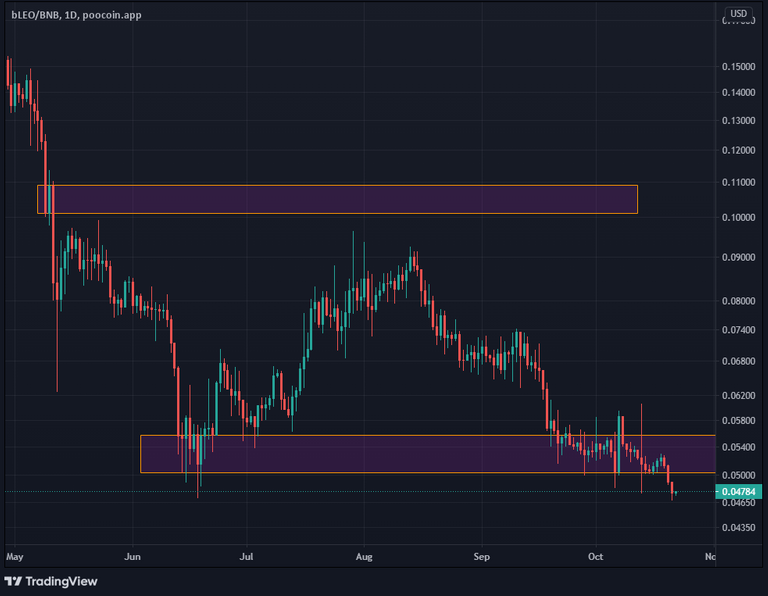
The chart above is from the statistics site called Poocoin. Leo/USD data from Bleo/BNB chart. Data from Pancakeswap exchange. I preferred the daily time frame. There is a supply-demand zone in the 0.05-0.055 price range. It is located just below this area. The price level is $0.047. If the supply-demand region I mentioned is crossed upwards, the target will be the supply-demand region at the level of 0.1$. I hope the price does not continue its downward movement.
This is not a bullish or bearish signal. And this article is not investment advice. You should make your investment decisions yourself according to your psychological and financial situation. It would be more beneficial to see this sharing as an educational work. Ll see.
interesting considerations there
Thank you for your comment. It is useful to follow the graphs. We are in a time when the market harbors tremendous fears and opportunities.
@tipu curate
Thank you.
Thanks, now is the time to accumulate!! Its gonna pay off big time.
Yes. Fear and opportunity go hand in hand. It is very difficult to predict how the market will move in the coming days.
https://twitter.com/1480840258828779521/status/1583833623845031936
The rewards earned on this comment will go directly to the people( @mypathtofire ) sharing the post on Twitter as long as they are registered with @poshtoken. Sign up at https://hiveposh.com.
I enjoy collecting all these tokens from the local bottoms. In the case that BTC tests 12-14k, I am ready to buy them cheaper 🤩
Before Bitcoin rises, I also have a bearish expectation. Small fish are still active in the market. It is unlikely that an uptrend will start without them being afraid. There are great opportunities for those who collect from the bottom :)
This post has been manually curated by @bhattg from Indiaunited community. Join us on our Discord Server.
Do you know that you can earn a passive income by delegating your Leo power to @india-leo account? We share 100 % of the curation rewards with the delegators.
Please contribute to the community by upvoting this comment and posts made by @indiaunited.
!BEER