11 Red Weekly Successive Candles in Ethereum Price Chart!
Ethereum price is going down as shitcoin. There is 11 red weekly successive candles in Ethereum price chart. We have never seen this price move... 5 red weekly successive candles was the record for Ethereum!
Ethereum lost more than 70% in 11 weeks! Something bad came for Ethereum? There is no solid news about this but this price move looks like a shitcoin move. Rugpull?
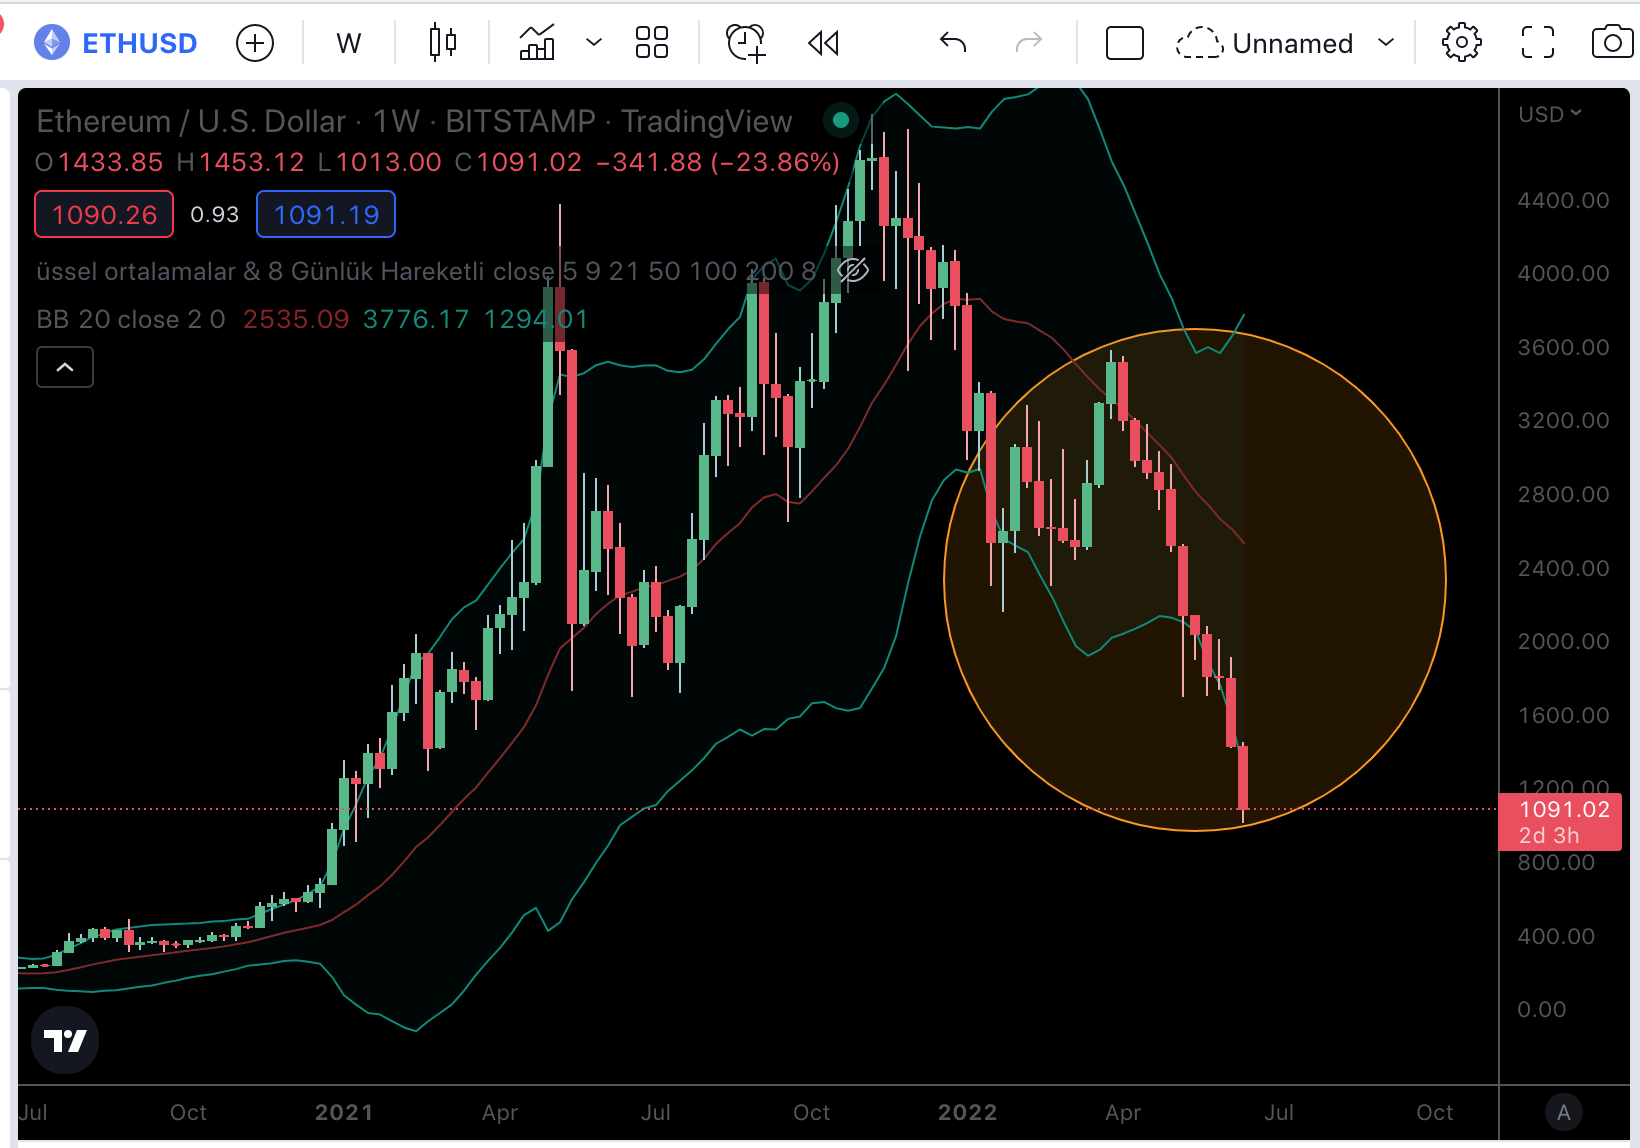
While Ethereum going down in 11 weeks, It is one of the worst altcoin performance...
But there is good news, Weekly RSI Indicator of Ethereum is at oversold level!
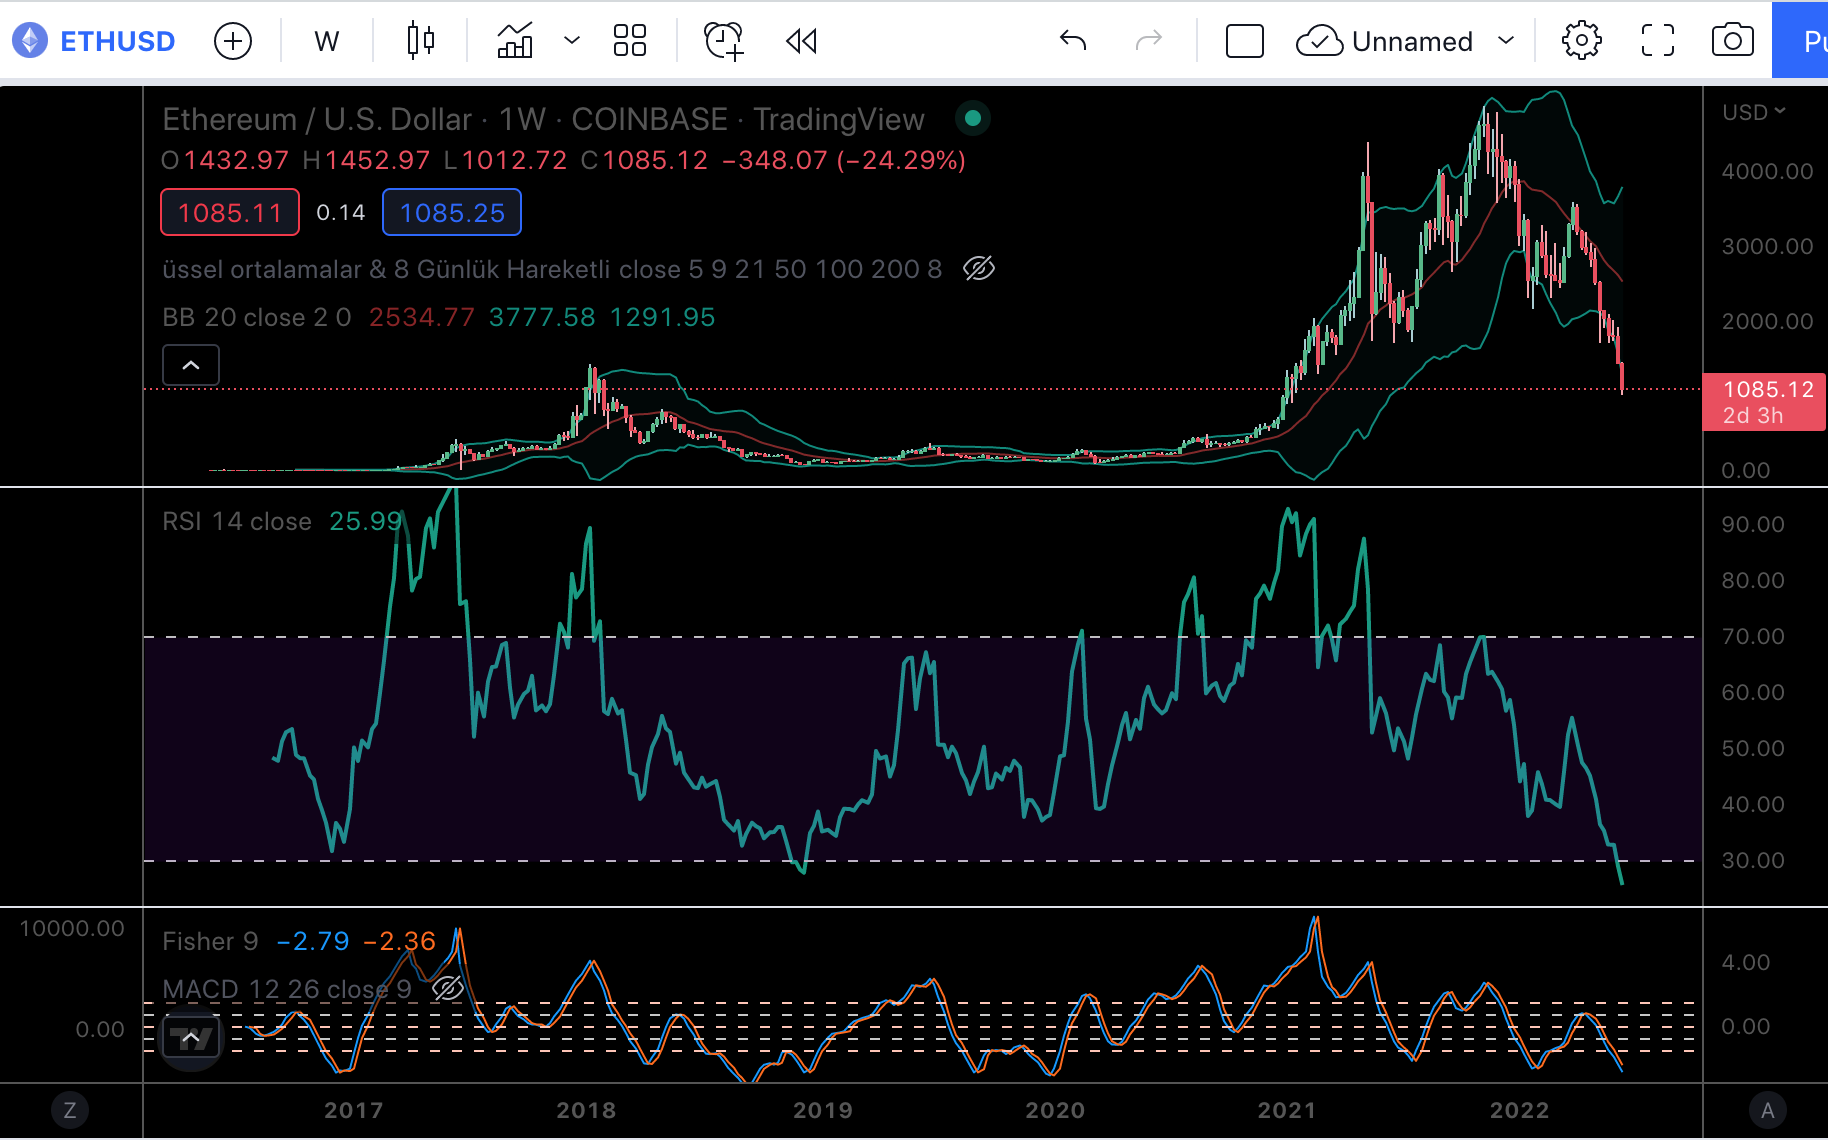
Ethereum was oversold in December 2018 and ETH had green huge candle about 56%! Will we see same move like this?
I think we will see green weekly candle in next week!
Ethereum is on oversold level for daily chart. It is in consodilation. It is possible to break up this oversold zone...
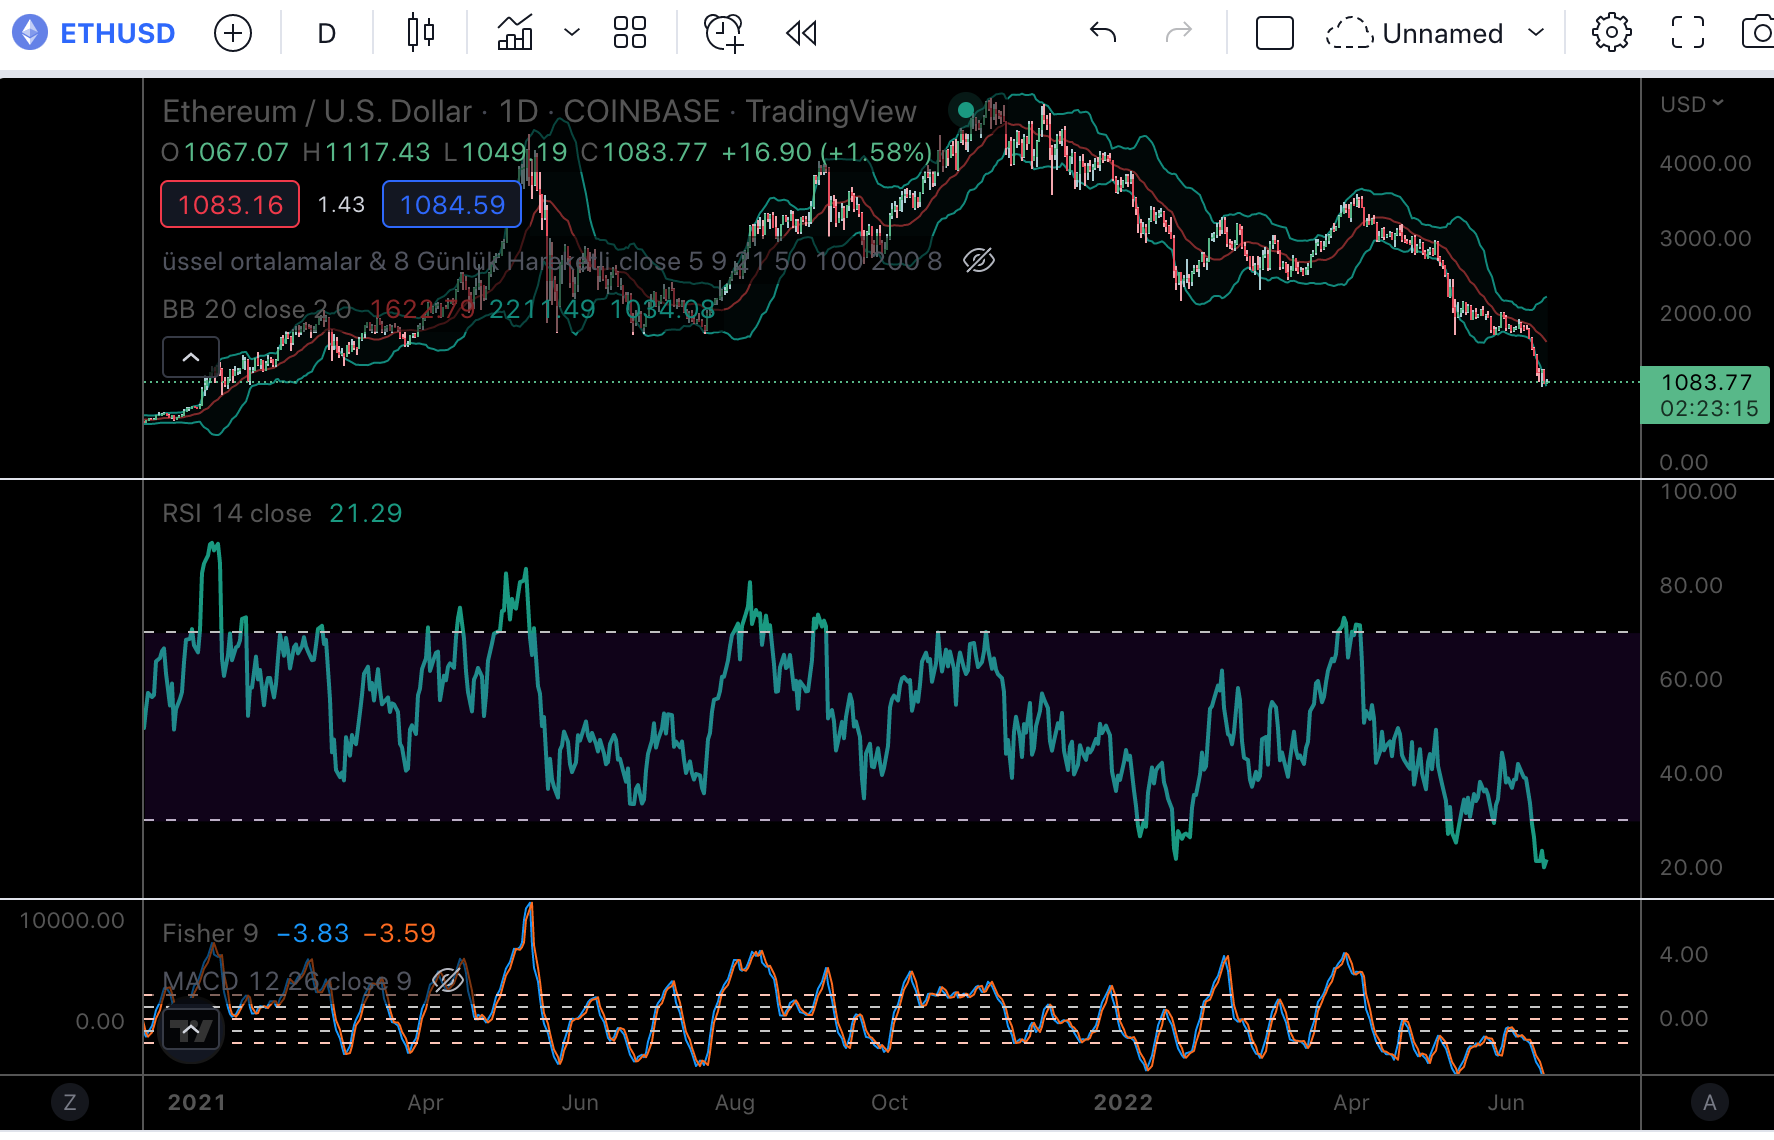
We will see..
Posted Using LeoFinance Beta
I hope things changes soon. The bitcoin and eth usdt prices are both sitting on 200MAH. I hope it doesn’t break that.
View or trade
BEER.Hey @chorock, here is a little bit of
BEERfrom @pixresteemer for you. Enjoy it!Do you want to win SOME BEER together with your friends and draw the
BEERKING.ETH is getting hammered, glad I rebalanced a while back. It's down 40% in a week! Crazy times!
Posted Using LeoFinance Beta
This is just too craze for crypto, the story with change anytime soon
Posted Using LeoFinance Beta