Big Bowl Pattern on Bitcoin Price Chart
While Bitcoin price reversing from the bottom, Bitcoin began to draw big bowl pattern. It is reversing pattern and price should go up fastly not to destroy this pattern.
While Bitcoin price touched 19500 USD, there was important level for this pattern. It is supported by big bowl pattern and price went up!
It is good reversing pattern but price should follow this pattern. Support line is increasing logarithmic. It is not linear. Price should gain acceleration..
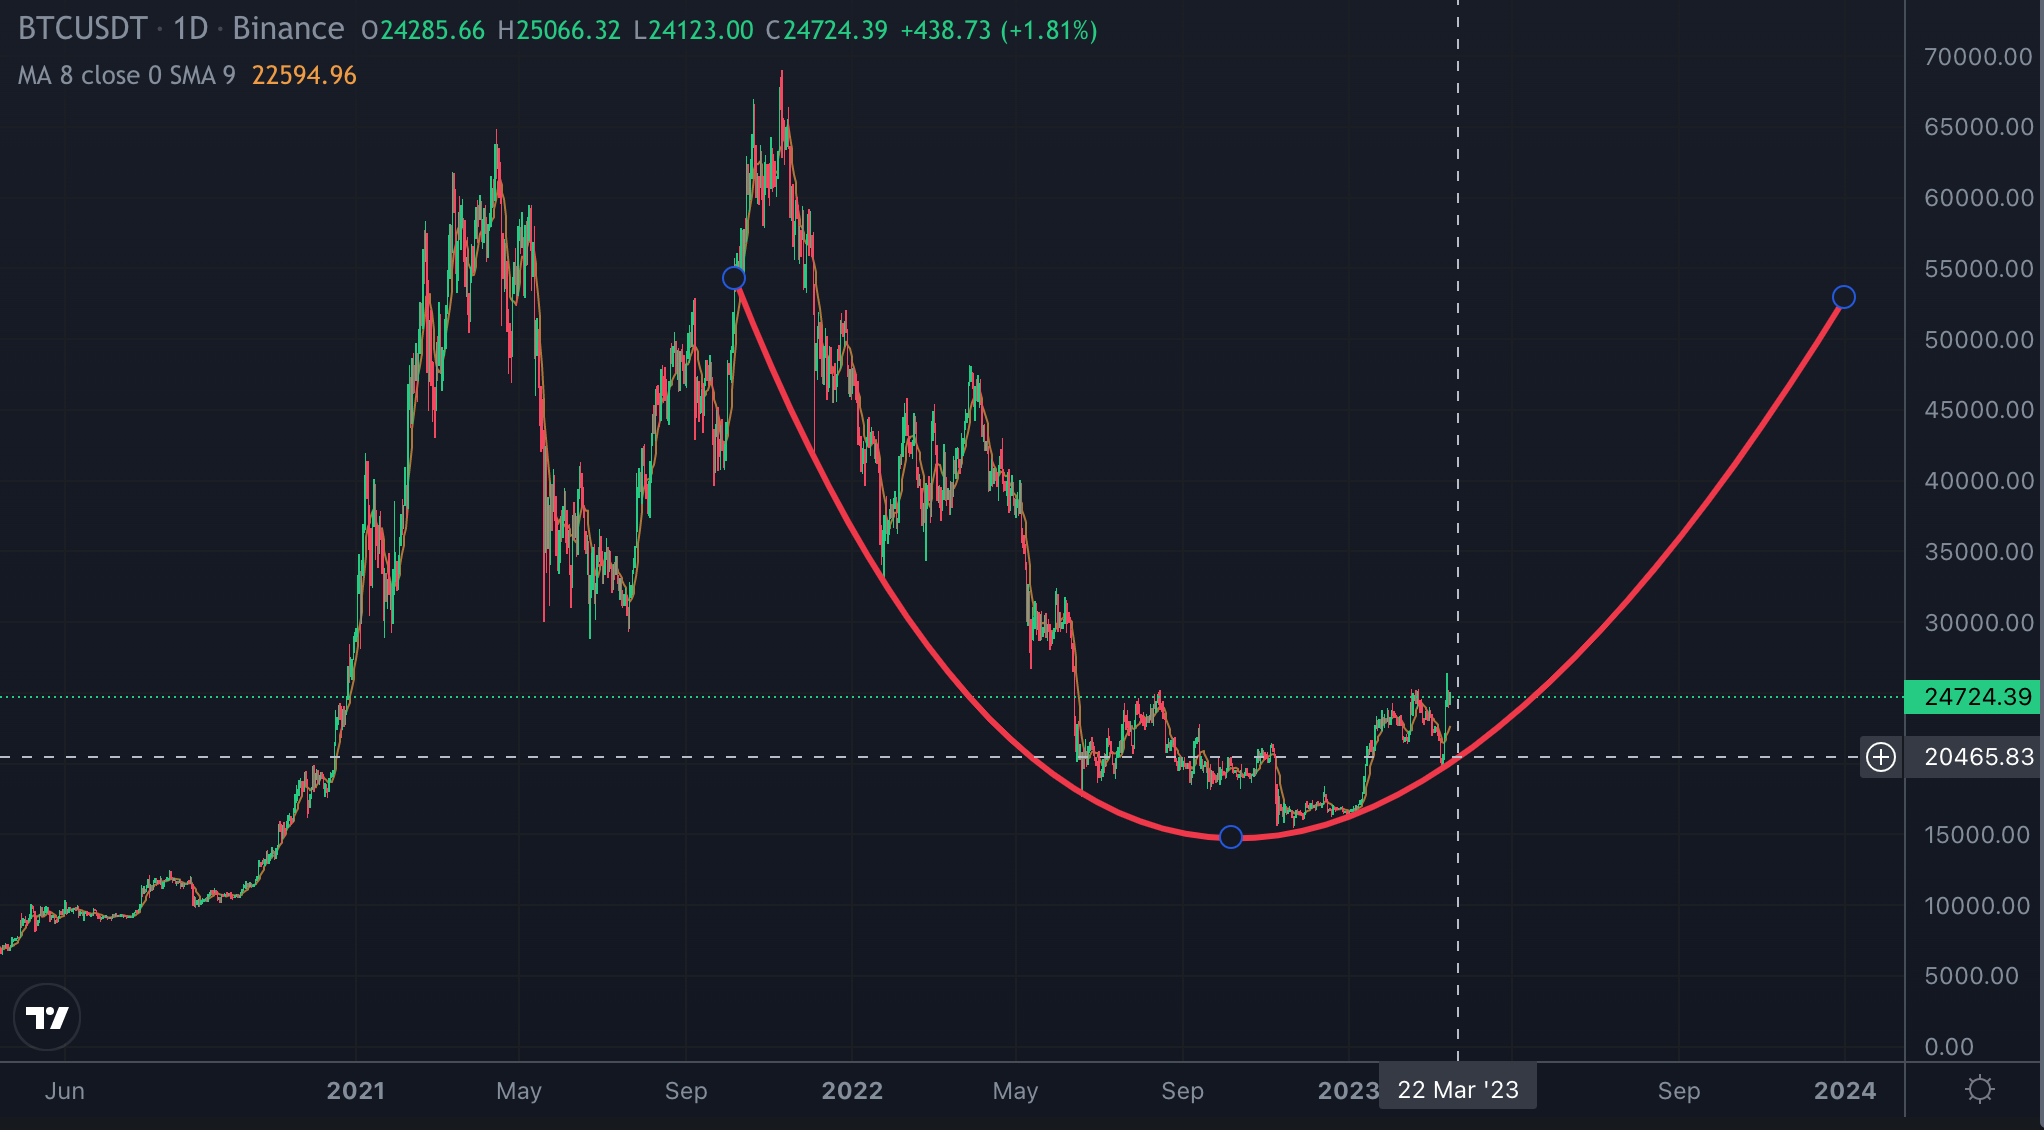
If price cant get acceleration, Price breaks down this pattern and we may see huge drop on Bitcoin price chart. It will take long time to get ready for the new pattern...
Here you can see 3-day moving average on Bitcoin price chart. There is a resistance on MACD Indicator and It is on decision point. If it break up or If it is resisted..
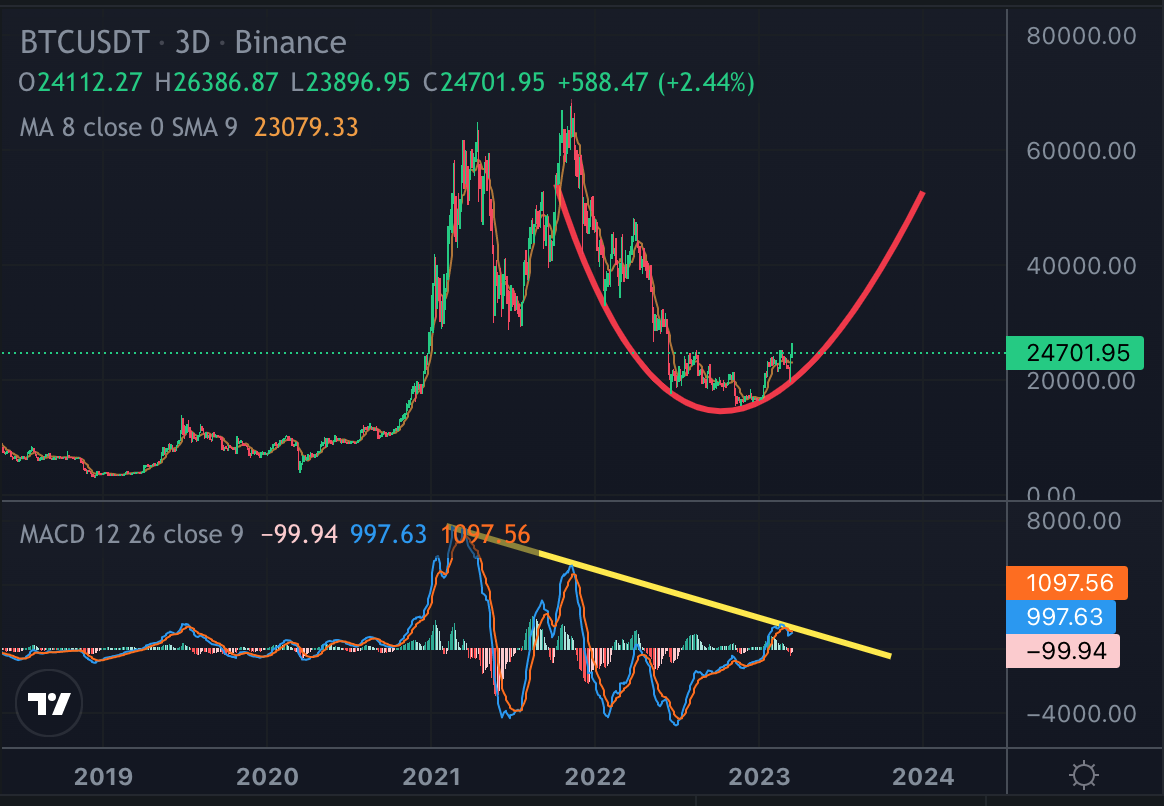
It is the decision week for Bitcoin.
We will see.
Posted Using LeoFinance Beta
