Bitcoin is Close to High Volatility Time
Bitcoin price stucked between 74K and 62K USD level. Market is boring when there is no volatility. Bitcoin price supported by 8-week moving average in a few weeks. It is one of major support level for Bitcoin. It shows us the midterm trend.
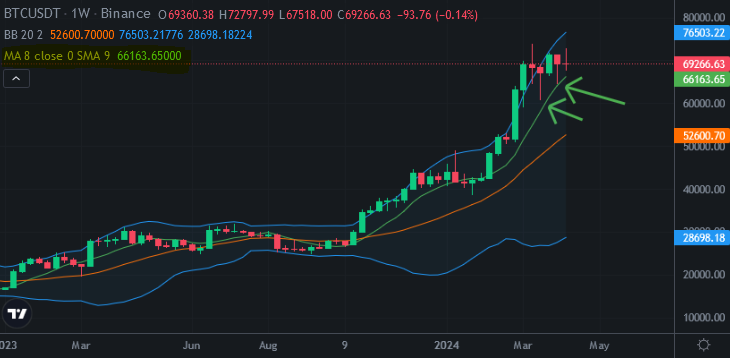
Here you can see weekly chart of Bitcoin. I shared an analysis about 8-week moving average a few days ago. Bitcoin tested 2 times in last month. Today Bitcoin tried to touch this level again...
8-week moving average is at 66K USD level. If we see weekly close below this average, the middle line of Bollinger Band will be major supporter for Bitcoin price. I can not imagine what altcoins will do If Bitcoin price touches this support line..
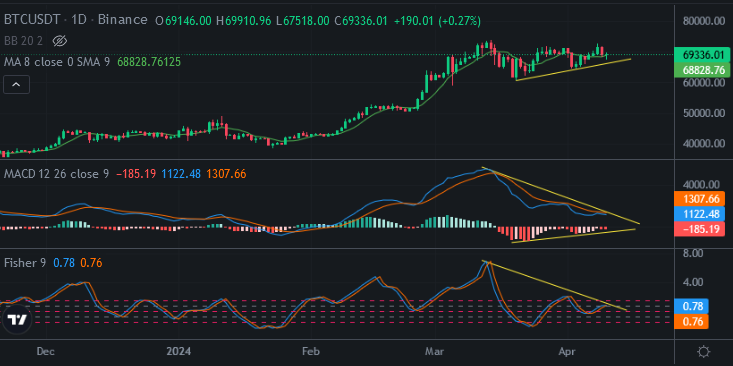
When we look at dailt chart of Bitcoin we can say that we are too close to high volatility of Bitcoin price. Here you can see the indicator below.
The bottom of price is getting higher during the bottom of MACD Indicator losing power. That means possitive divergence for price. We may see pump on Bitcoin price chart. You can also see MACD Indicator is trying to reversing up.,
There is downtrend line on daily chart of Fisher Indicator. It will be broken up in a few days. We may see price pump if that happens.
These are bullish volatiliy scenarios for Bitcoin price chart.
We can see bullish scenarios on daily chart of Bitcoin, bearish scenarios on weekly chart of Bitcoin.
So, volatility is coming soon.
We will see...
Posted Using InLeo Alpha
https://inleo.io/threads/chorock/re-chorock-yqya2nqc
The rewards earned on this comment will go directly to the people ( chorock ) sharing the post on LeoThreads,LikeTu,dBuzz.