Bitcoin Price is on Critical Support - What If It Breaks Down?
While Bitcoin has no volatility and voluma on 27K level It is on 100-day moving average. It is important level for Bitcoin that worked hard support and resistance before...
You can see daily chart of Bitcoin and what happened when Bitcoin broke up and down this moving average...
There is 100-day moving average coloured blue. It is 2nd time after Bitcoin is being traded above this average in 2023.
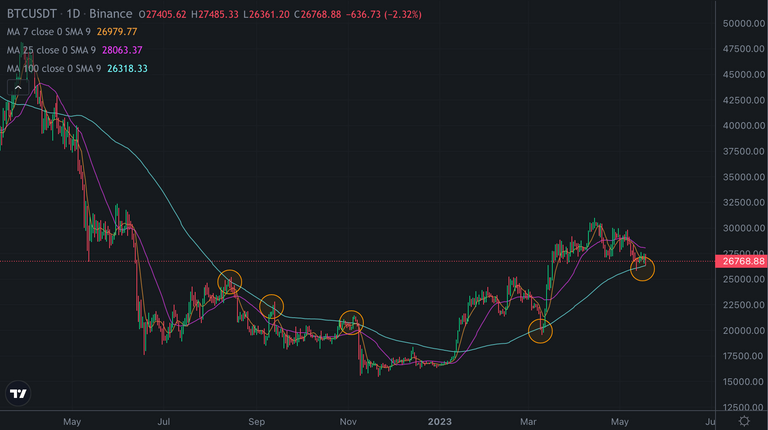
When Bitcoin went down from 25K to 19500 USD, this support line worked as a rock and Bitcoin price went up fast from 19500 to 30500 USD...
But Now, Bitcoin may not have this power..
Here you can see MACD Indicator on Bitcoin price chart..
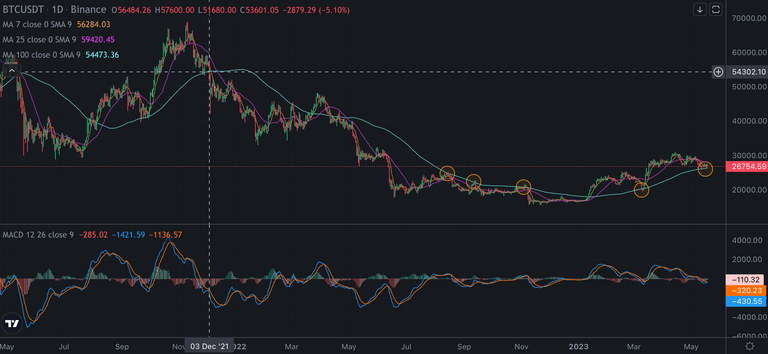
There may be a similarity between 3rd December 2021 and now. MACD Indicator moving and level were same as today... Price was above 100-day moving average..
So, If price breaks down, we may see huge dump on Bitcoin and market...
We will see...
View or trade
BEER.Hey @chorock, here is a little bit of
BEERfrom @pixresteemer for you. Enjoy it!Do you want to win SOME BEER together with your friends and draw the
BEERKING.