Bitcoin Price Resisted by The Middle Line of Bollinger Bands
Bitcoin price is under price correction. Even It went down from 74K to 61K, price correction may not be completed. It is only 7th day of price correction.
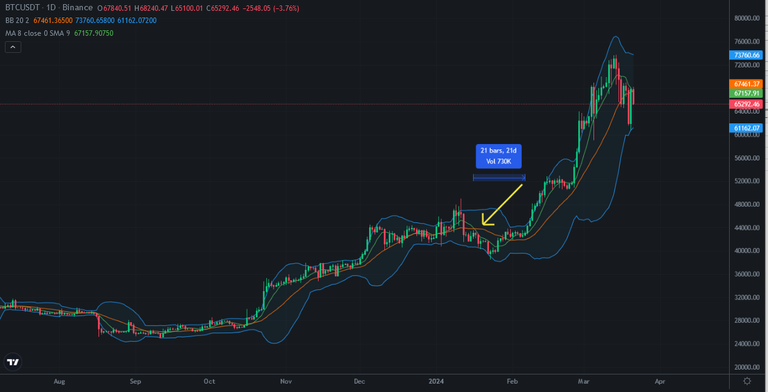
Bitcoin price is under the middle line of Bollinger Bands. It is one of major resistance and support line for Bitcoin.
Here you can see daily chart of Bitcoin and you can see how it worked as support and resistance before.
Bitcoin price resisted by the middle line of Bollinger Bands in January. It took 21 days to escape.
Now, Bitcoin price is under this resistance. How many days will it take?
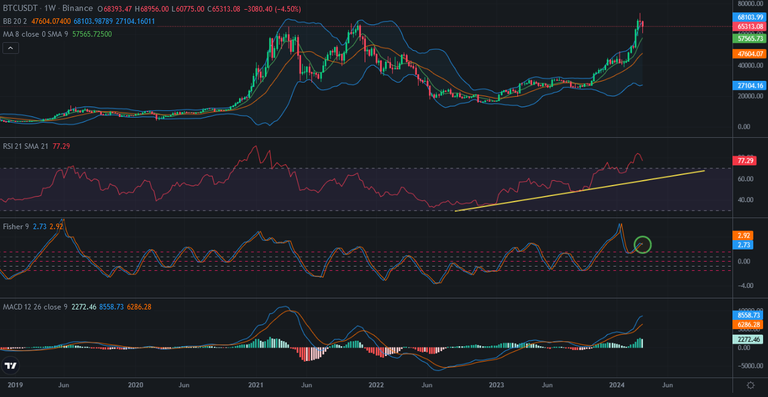
I think it may take more tha January. Here you can see weekly chart of Bitcoin and Fisher Indicator reversed from the top. Bitcoin price may enter price correction for weekly chart. So, this price correction may be longer than January.
If Fisher Indicator reverses, it will be trigger for the MACD Indicator on weekly chart. If MACD Indicator reverses on weekly chart, It may take too long time.
I shared lots of analysis and said price correction was coming soon. It came.
I am trying to predict the time period of this price correction. We may be under price correction until May!
We will see..
Posted Using InLeo Alpha
Hopefully it leaves some room for alts to fly.