BTC Price Broke Weekly RSI Resistance - So?
BTC Price broke weekly RSI resistance last week and It was great resistance for weekly RSI chart!
I shared a post It was one of important weekend for BTC price. RSI broke the downtrend without any crash. This may indicate that the way for BTC price is clear in the mid-term.
After breaking RSI weekly resistance I will not be surprised to see BTC on ATH!
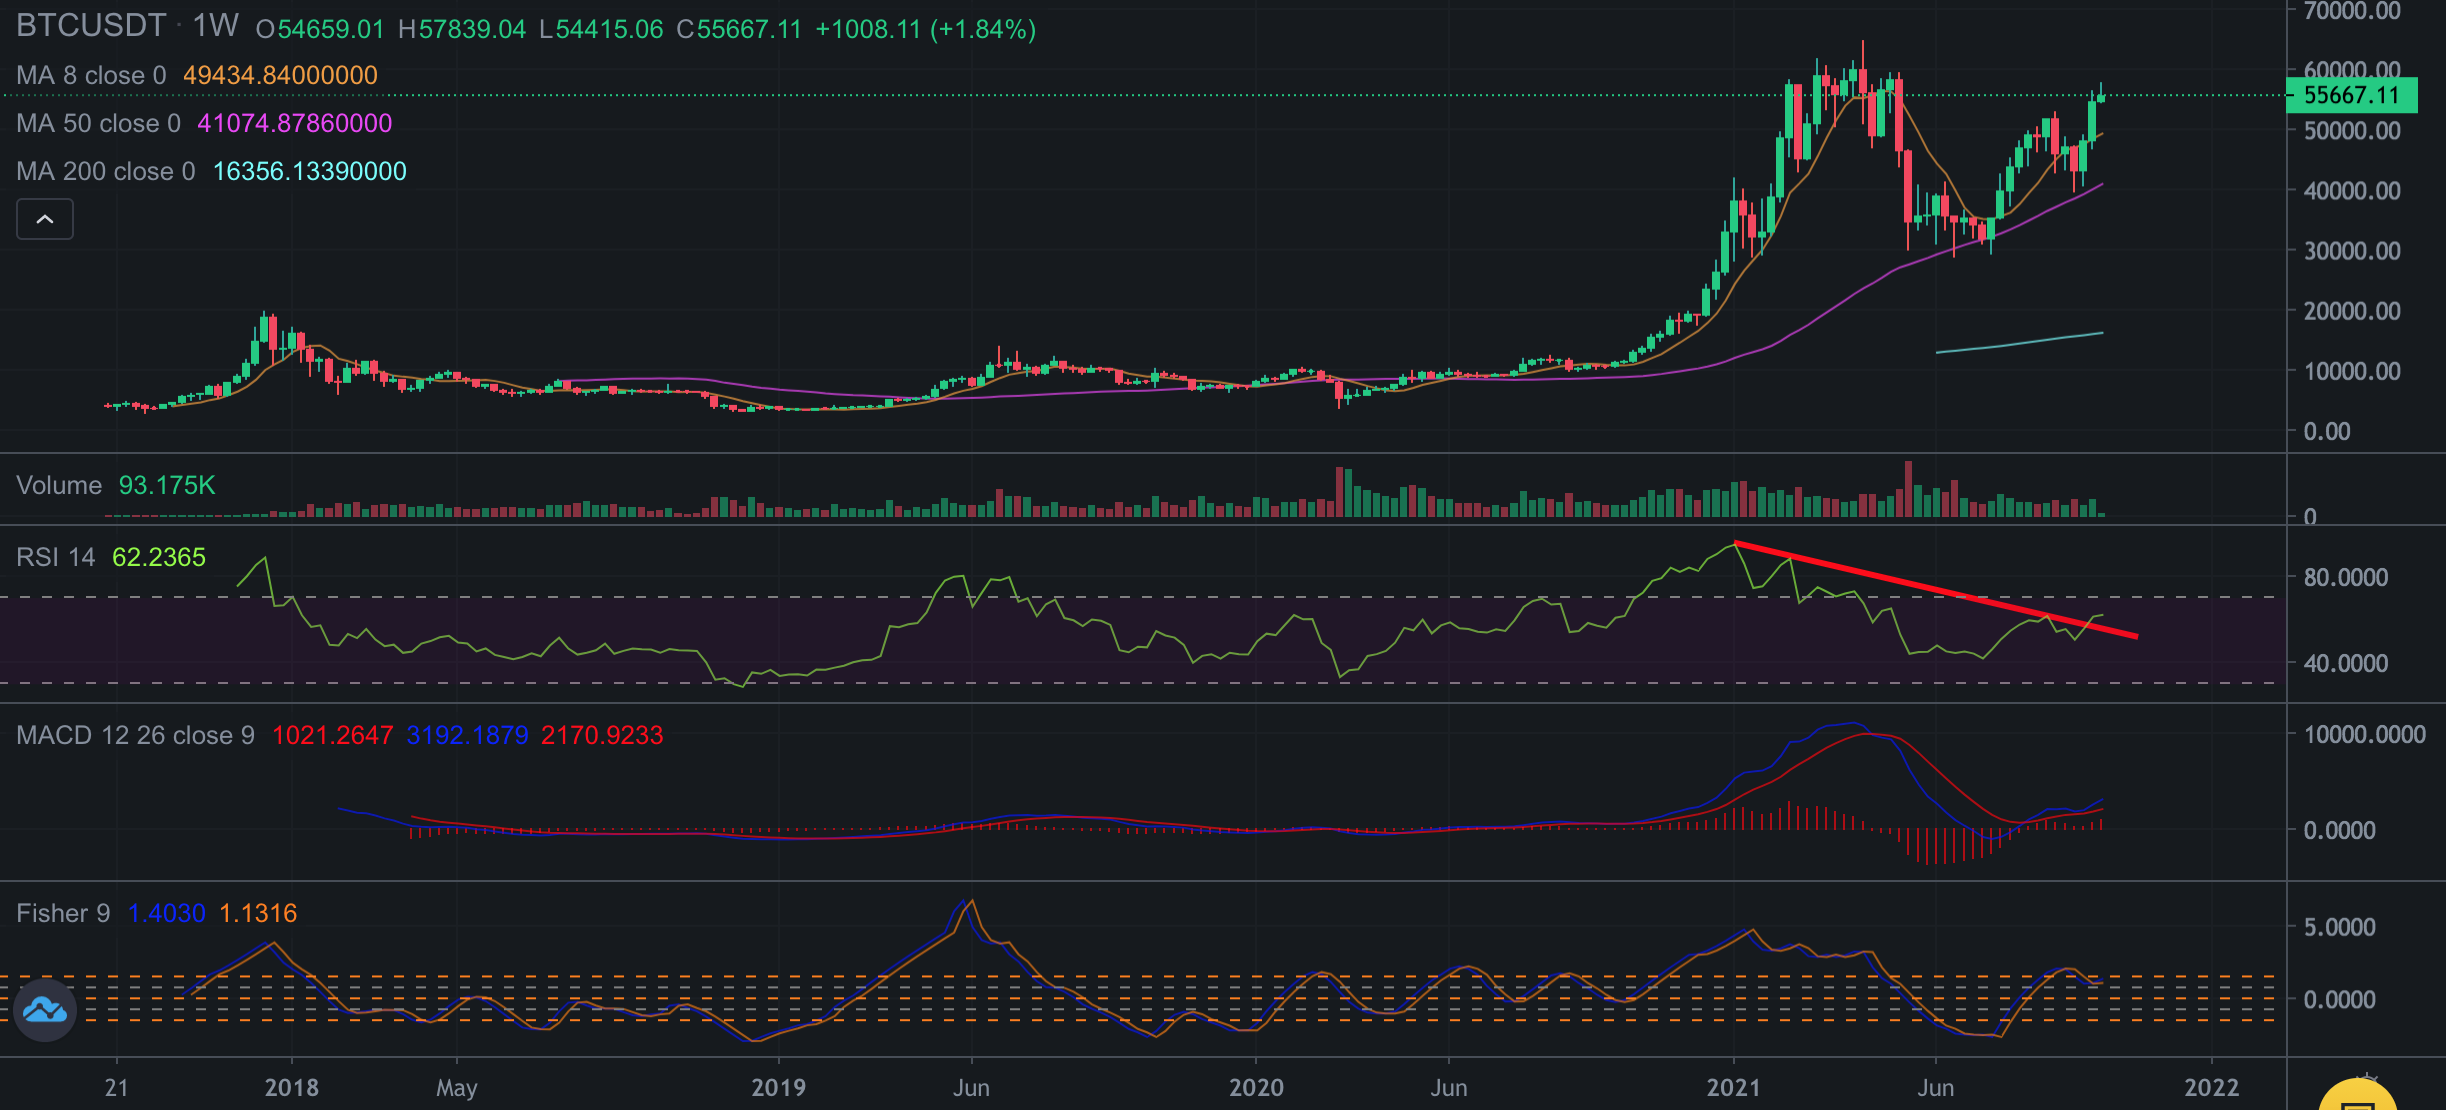
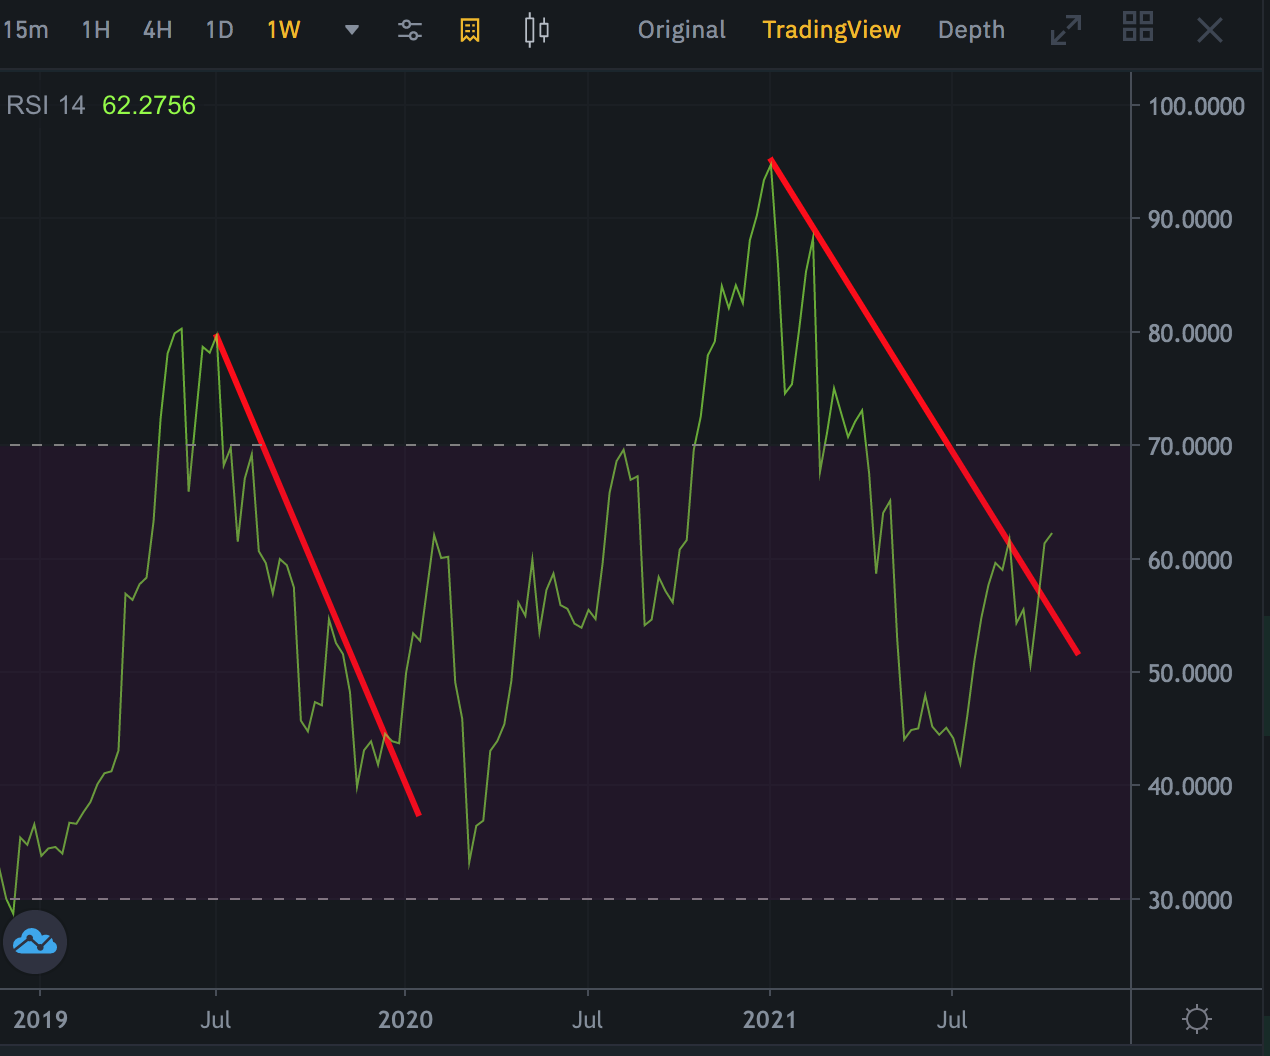
Weekly Chart
You can see RSI weekly chart what happened when RSI weekly resistance broken... This pump may show us ATH...
But wait...
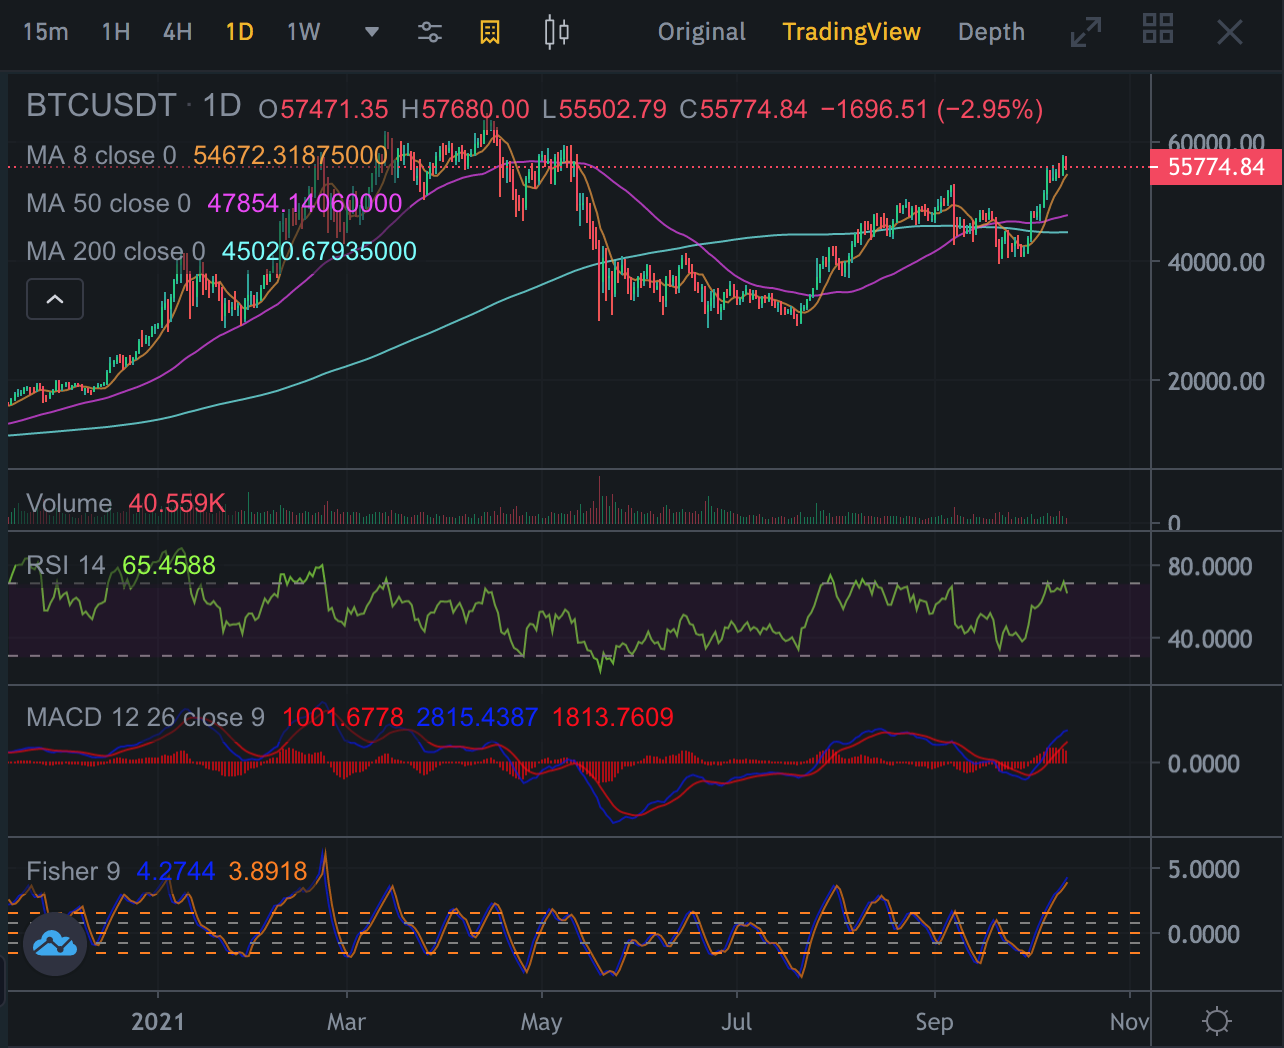
Daily Chart in Danger!
Daily chart of BTC in danger. Those who open long positions need to be cleared from the market.
As you see daily chart of BTC, a correction is coming soon... Fisher indicators is going to moon.. It will turn down in a few days. When it turns down, Price may be below 8-day MA. It is signal of mini trend...
This year is hard to predict the price of BTC. Because of their long and short positions, market makers are making very misleading moves.
Therefore, consider my analysis as a possible scenario..
Let's see...
Posted Using LeoFinance Beta
View or trade
BEER.Hey @chorock, here is a little bit of
BEERfrom @pixresteemer for you. Enjoy it!Do you want to win SOME BEER together with your friends and draw the
BEERKING.