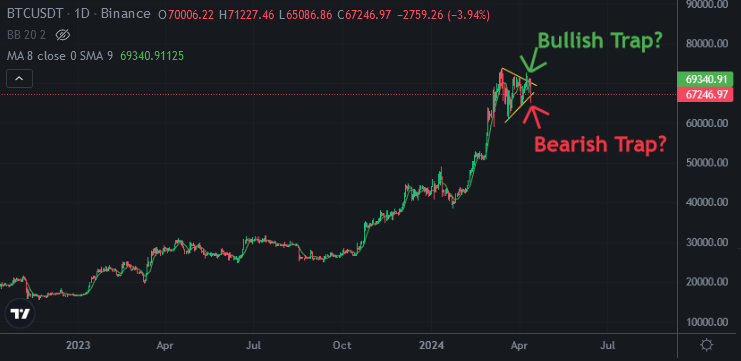
Bullish and Bearish Traps are on Bitcoin Price Chart
There are n-both bearish and bullish traps on Bitcoin price chart. Bitcoin made a fake move while breaking up downtrend line. Lots of Investors were waiting for this breaking up. They thought that Bitcoin drew bullish flag pattern. But after this breaking up Bitcoin price went down and entered again in flag..
Today Bitcoin price went down with the news of Iran and Israel crisis. Lots of altcoin are down more than 20%. Bitcoin price touched 65K USD today. Is it a bearish trap?
After touching 65K, Bitcoin broken down support line. After breaking support line, Bitcoin went up into flag pattern. It may be a bearish trap as bullish trap a few days ago..
There are traps on Bitcoin price chart. Bitcoin is trying to find the direction. I shared an analysis and said volatility was coming soon. It came..
Today is one of most volatility day in 2024. Lots of altcoin went down as from waterfall.
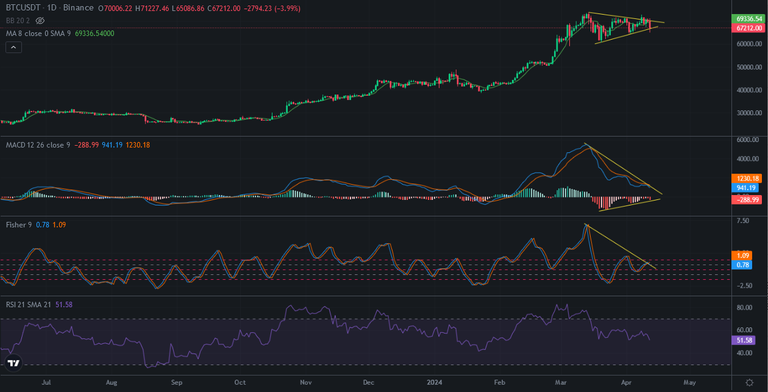
When we look at the daily chart of Bitcoin's indicators, we can see downtrend line on MACD Indicator. It will be crossed in a few days with uptrend line. MACD Indicator stucked into this lines. We can predict the direction of Bitcoin price after this crossing..
We may see stable days for Bitcoin in April. but May will be more volatility for Bitcoin price.
Sell in May go away was true for Bitcoin last year. We may see again in this year.
May is coming.. We will see...
Posted Using InLeo Alpha
https://inleo.io/threads/chorock/re-chorock-2uo7uphaj
The rewards earned on this comment will go directly to the people ( chorock ) sharing the post on LeoThreads,LikeTu,dBuzz.
Does feels like the market over all is trying to shake down the halving hype, type of sell the news event, after all Bitcoin did went from 15k to 70k in a year so yeah probably a healthy drop before going up towards the end of the year, I have seen quite a few ppl online saying "this time is different" 🤷♂️