Hive Price Broke Down Great Support - Time to Correction
I shared lots of analysis posts about Hive Price chart. Hive Price is in bullish trend. But, Hive Pice broke down 1st great support line coming from 15th June...
It was ultra fast support line has huge slope.. Hive price has another support line coming from Luna crash. Very Likely It will be the support of going down...
I said lots of times that Hive is major signal to look for crypto market in big window..
Here is daily chart of Hive and You can see broken RSI Indicator support line in red, Yellow one will be 2nd support line for midterm..
I didnt expect that red line wouldnt be broken down but I happened.
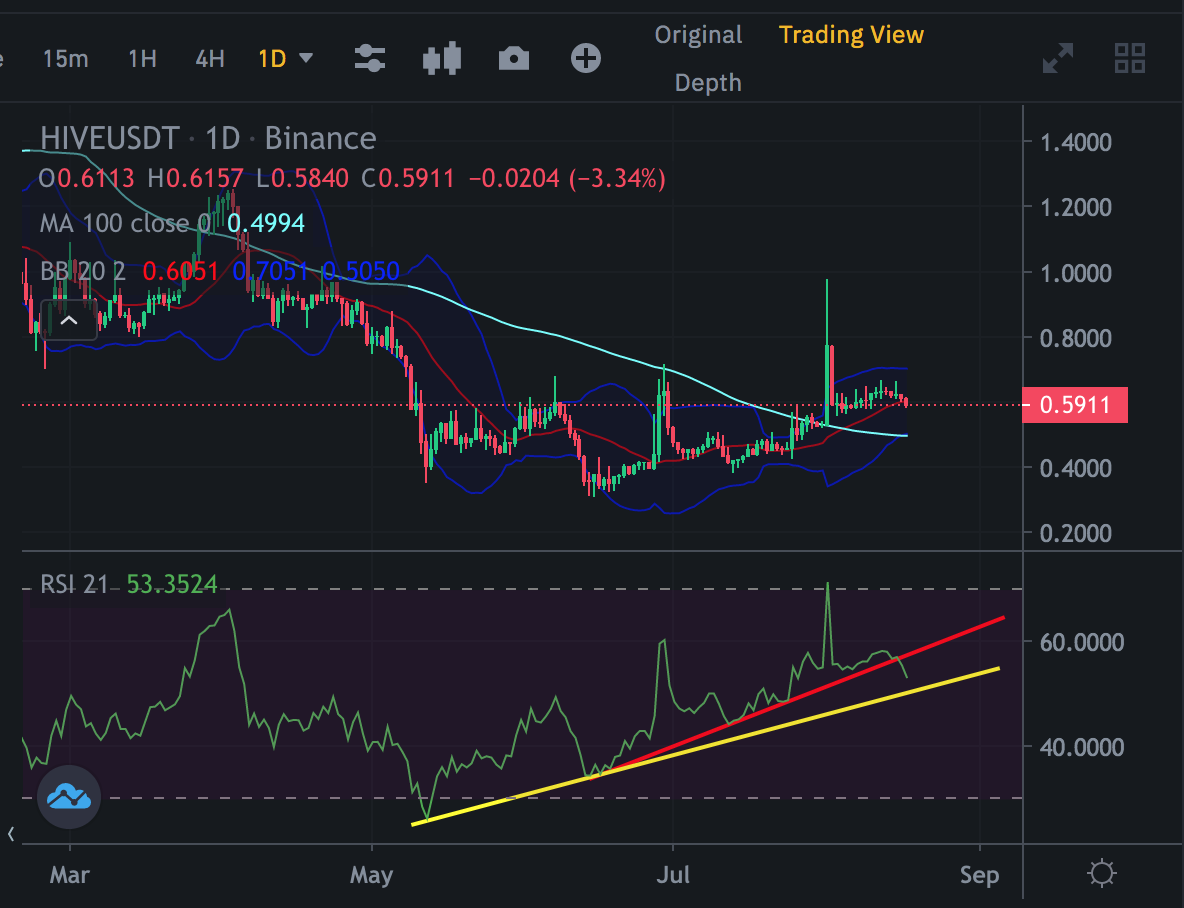
The bottom of Bollinger Band is about 0.52 USD and 100day Moving average is at 0.49 USD.
These levels may be the bottom for Hive price in correction.. Fisher Indicator should also reverse. It may take a few days...
We will see...
Posted Using LeoFinance Beta
I also think that prices will pull back in the crypto market. I feel weakness in the prices after two months of the rally. My feeling stems from hourly price action. I have observed consecutive red figures for many hours.
Posted Using LeoFinance Beta
I think 22K will be the new bottom of Bitcoin. I will follow RSI Indicator thay may break up great resistance end of August after 22K to over 25K...
When RSI Indicator resistance broken up, Down Trend will be ended...
We may not see this level again...
I think there will be growth in the cryptocurrency market. And Hive has a pump at the end of August.