LEO Price Broke Up Great Resistance After 600 Days
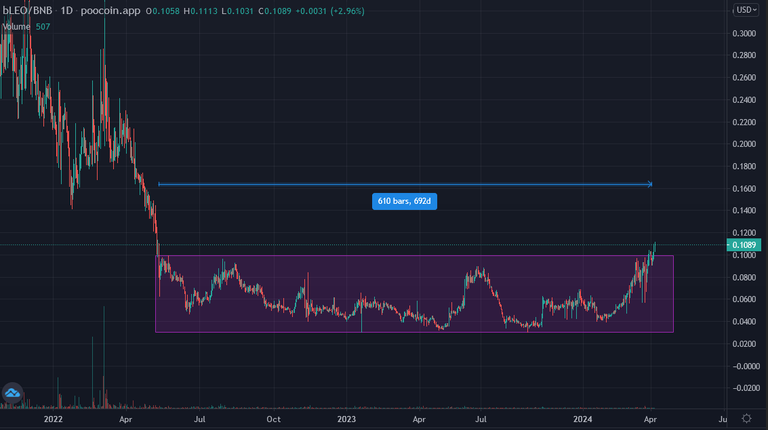
LEO price had been into consolidation zone for 600 days. I shared lots of analysis for LEO price and said It may be pick up level for LEO. Finally, LEO broke up the top line of this consolidation zone which is great resistance..
Here you can see daily chart of LEO. I drew this consolidation zone. We follow this zone. LEO price broke up this zone and it is free to go up!
I waited to see daily close above this zone and It happened..
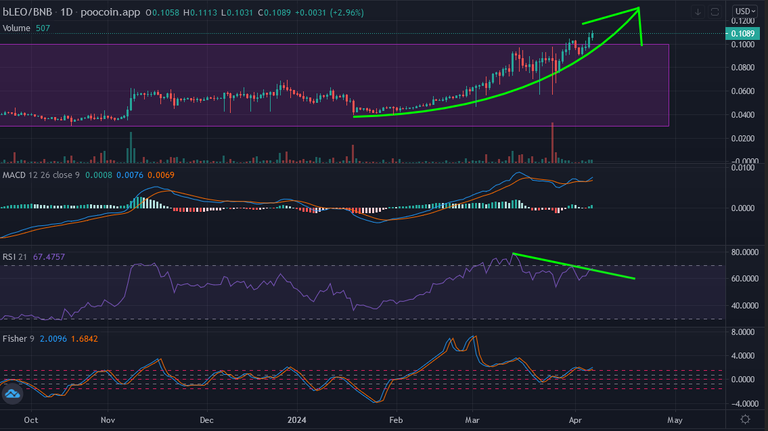
When we look at the Indicator of LEO price, this bullish trend may continue. LEO price went up parabolic since the end of January. It went up from 0.04 USD to 0.11 USD. It present more than 2,5x profit.
There is parabolic support line on LEO price chart. I like parabolic pumps..
We may see LEO price above 0,15 USD in this bullish trend. Even Bitcoin price entered price correction after touching 74K USD, LEO price has great bullish performance..
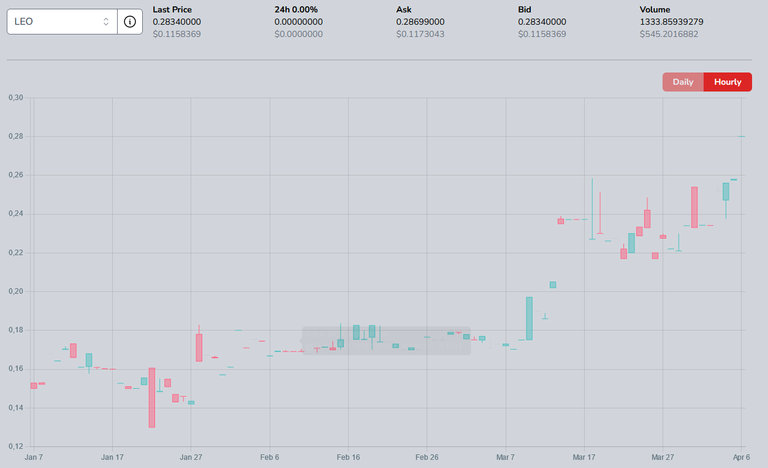
Hive price also supported LEO price. Hive price went up slowly. When we look at LEO/Hive pair chart, it seems very bullish. 1 Hive is equal to 3,5 LEO...
We can say that LEO price entered bullish trend. I hope the top line of consolidation zone will work as support.
We will see..
Posted Using InLeo Alpha
It is interesting to read that the graphs indicate that we are on the right track.