Similarity Between 2019 & 2023 Mini Bullish Trends After Accumulation
There are similarity between 2019&2023 mini bullish season after accumulation. Will it move same again?
Here you can see daily charts of Bitcoin 2019&2023. Bitcoin price accumulated on the bottom after ultra mega bullish season, and Bitcoin entered mini bullish season. We saw 3 steps on 2019 mini bullish season. There are similarity between 2nd step of 2019 and now. We are at 2019's 2nd step of mini bullish season If Bitcoin will follow same move..
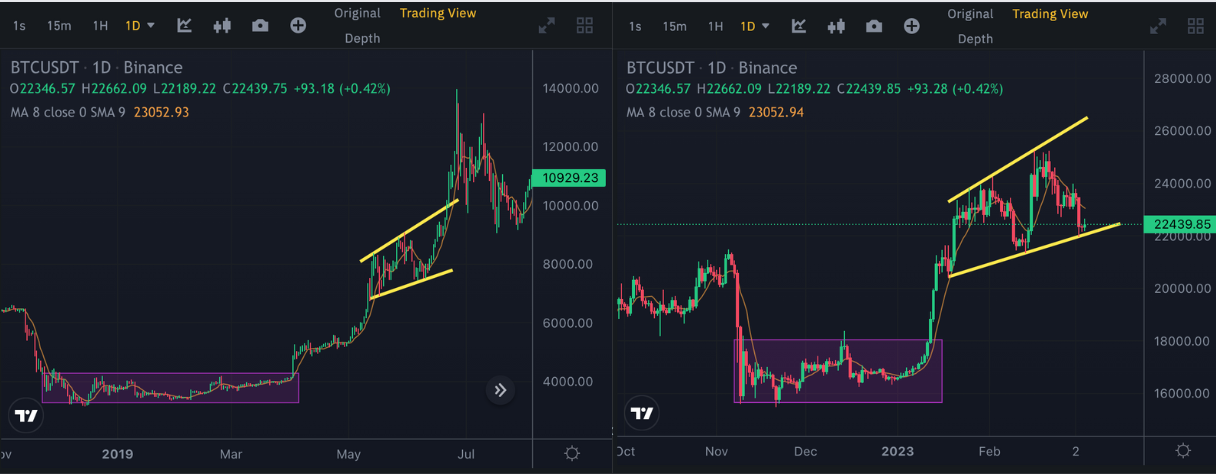
Bitcoin should not break down yellow support line. It is decision for Bitcoin move direction. If it is broken down, We may see Bitcoin price is on 16K again. Again for accumulation after mini bullish season.
But Bitcoin may go up and break up great resistance on 25K. It seems very difficult with market conditions on 2023.
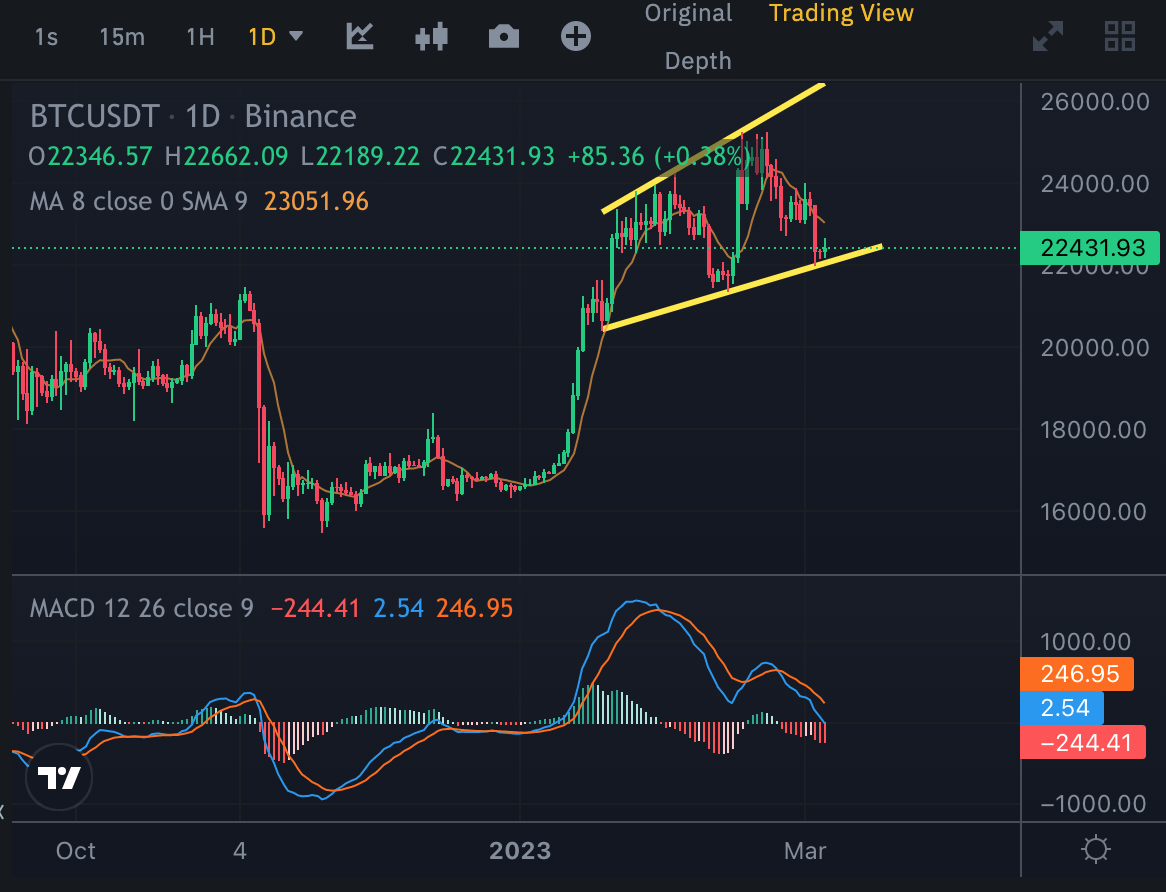
Here you can see daily chart of Bitcoin and MACD Indicator is going down to 0. Bitcoin may do something. Because It ha only a few days to make a decision for direction.
What is your thoughts about this similarity and future move?
Posted Using LeoFinance Beta
Congratulations @chorock! You have completed the following achievement on the Hive blockchain And have been rewarded with New badge(s)
You can view your badges on your board and compare yourself to others in the Ranking
If you no longer want to receive notifications, reply to this comment with the word
STOPCheck out our last posts:
Support the HiveBuzz project. Vote for our proposal!