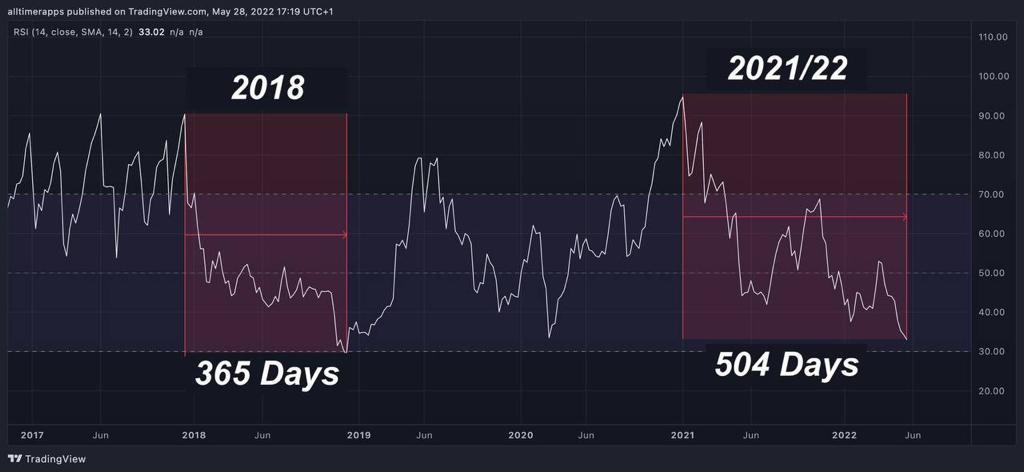
Weekly RSI Indicator of Bitcoin is Going Down for 504 Days
This is the longest term in Bitcoin Price that weekly RSI Indicator is going down for 504 days. It went down for 365 days in 2018..
We are close to bottom after 9 weekly red candle.. It will probably go down to the oversold zone in weekly RSI Indicator..
Here is rainbow chart of Bitcoin price. After Luna Crash, Bitcoin price touched the bottom. In Covid Crash, Bitcoin price was oversold and recovered in a week. Maybe we will not see oversold zone in 2022...
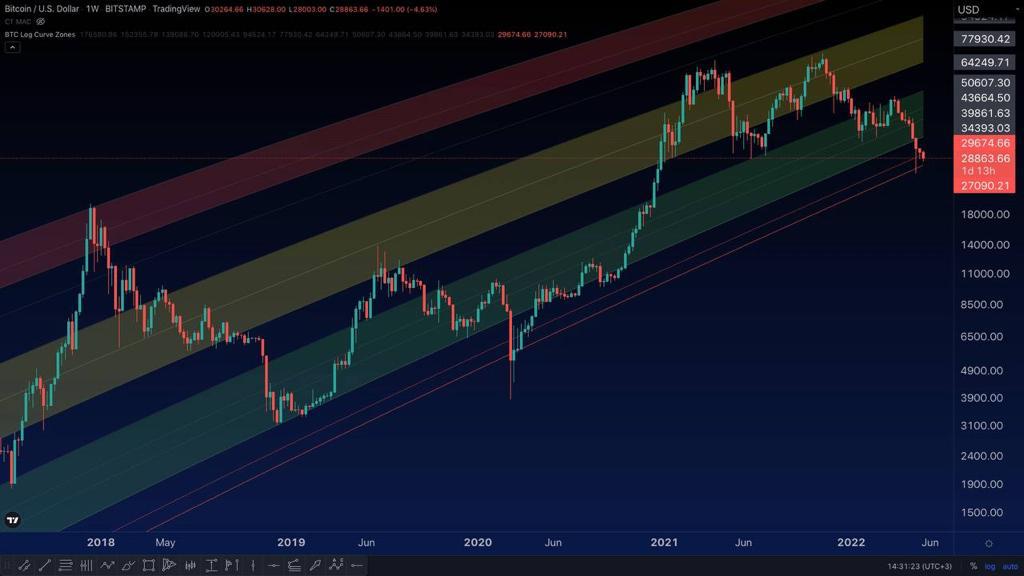
So, 10th candle may be green in Bitcoin price chart after 9 weekly red candle...
We will see...
Posted Using LeoFinance Beta
0
0
0.000
View or trade
BEER.Hey @chorock, here is a little bit of
BEERfrom @pixresteemer for you. Enjoy it!Learn how to earn FREE BEER each day by staking your
BEER.Congratulations @chorock! You have completed the following achievement on the Hive blockchain and have been rewarded with new badge(s):
Your next target is to reach 1600 posts.
You can view your badges on your board and compare yourself to others in the Ranking
If you no longer want to receive notifications, reply to this comment with the word
STOPTo support your work, I also upvoted your post!
Check out the last post from @hivebuzz: