Documented Trade #1 | Results
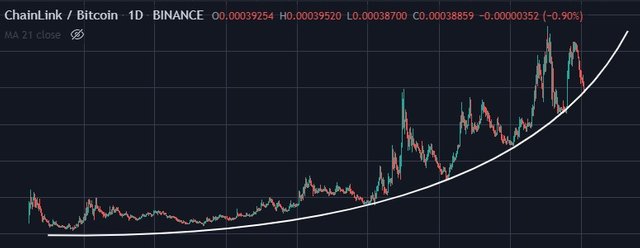
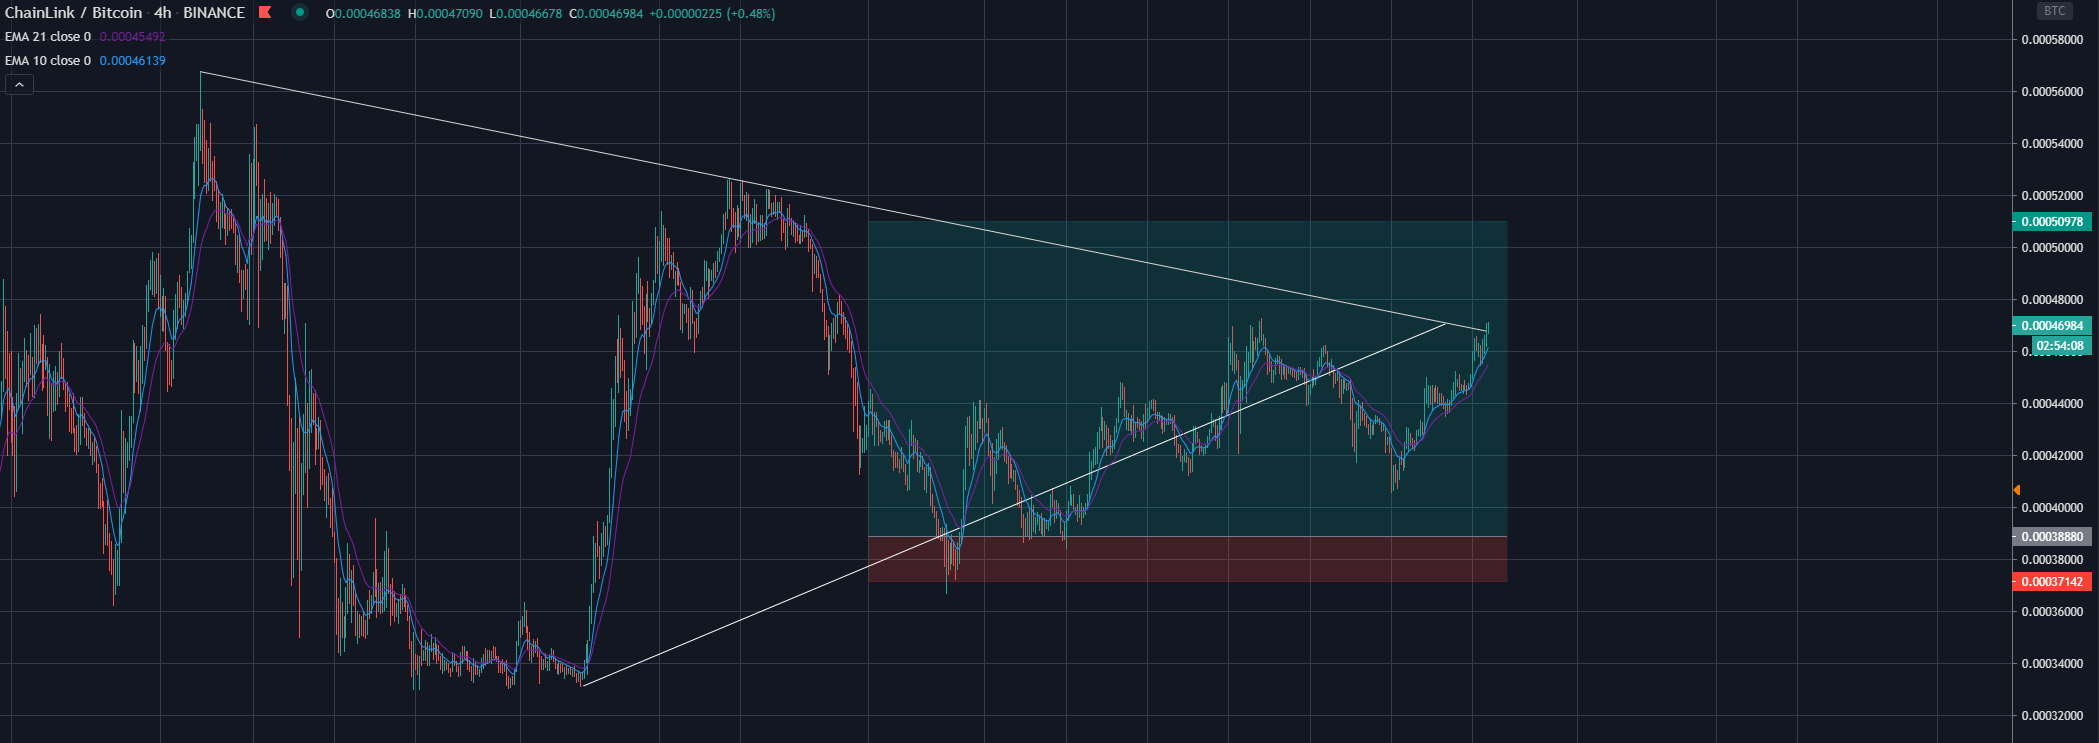
The trade on Chainlink vs BTC was based on support & resistance levels and the parabolic curve I had drawn and was following for a long time. This is what things looked like...
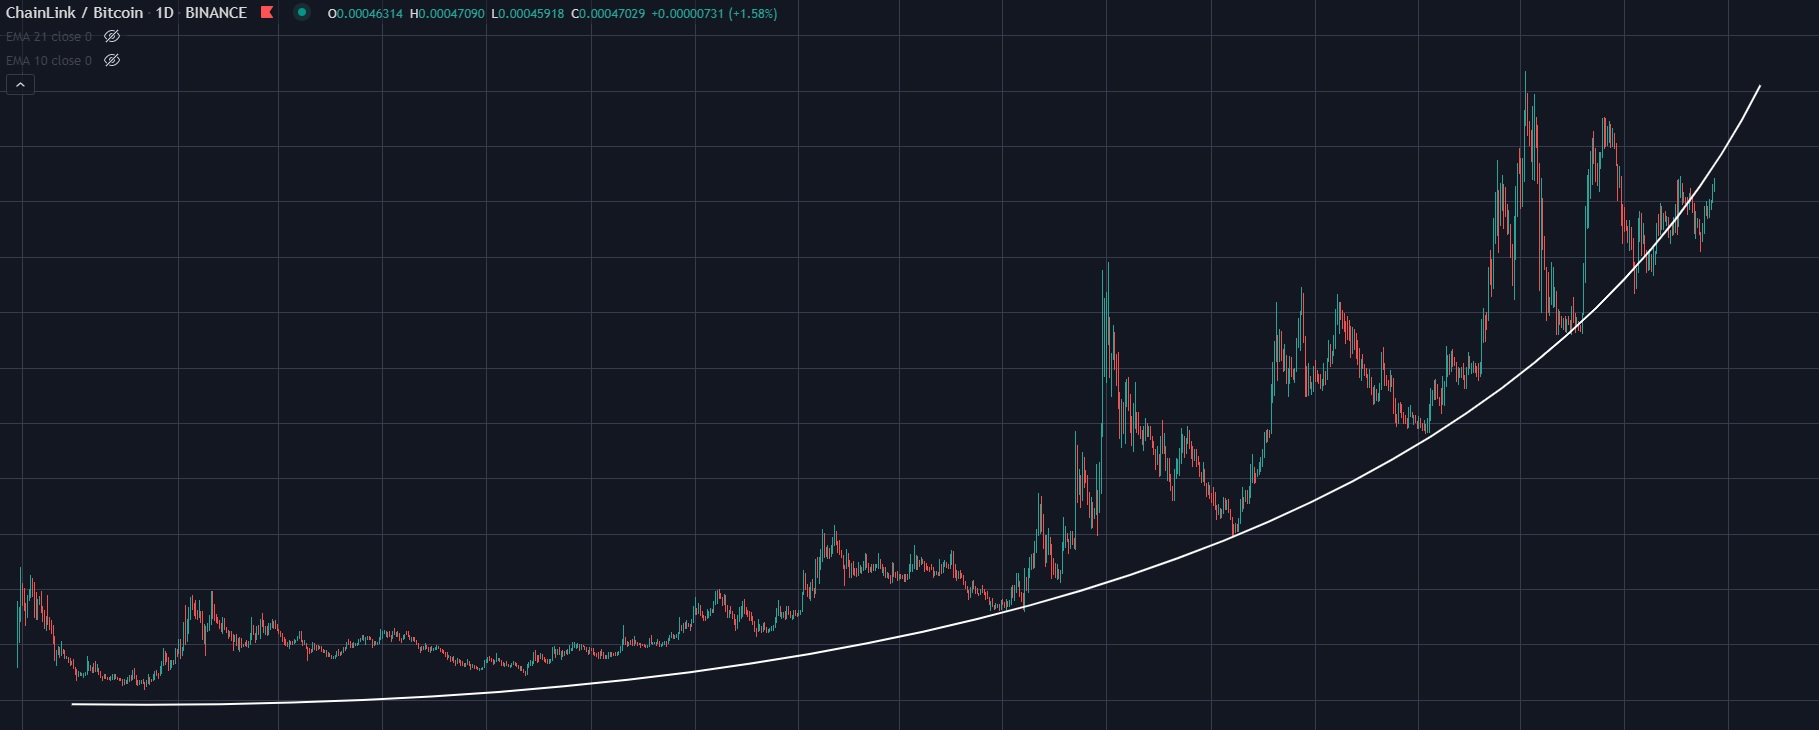
This is how the chart played out 47 days after making the trade keeping the same lines I drew originally.
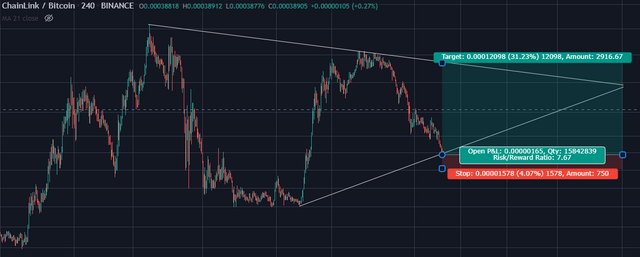
Almost right after making the trade, the price started to break to the downside and I quickly learned that I made a mistake in how the parabolic line was drawn. I had the line drawn before it even reached the previous point of support which didn't 100% match. I once read that many people draw the lines based on how they are most convenient so I didn't want to redraw it so that it fitted perfectly. So I fixed that mistake lowering the stop loss which turned out the be the right move as the price went as low as 0.00036707 BTC while my original stop loss was set 0.79% higher compared to the lowest point. when I redraw the curve it looks like this...
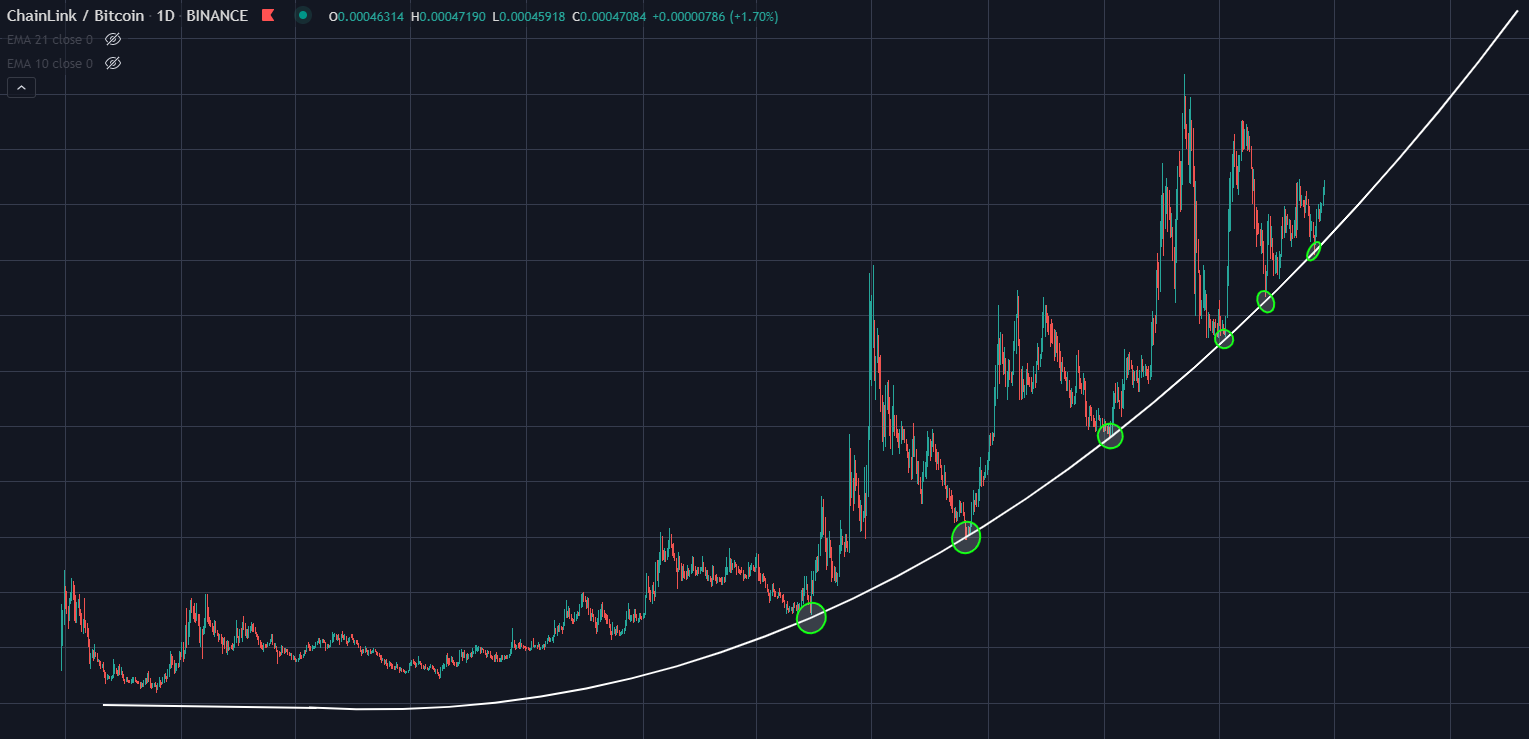
Link is pretty much still following the parabolic Uptrend vs BTC with 6 clear touching points on the support line so far.
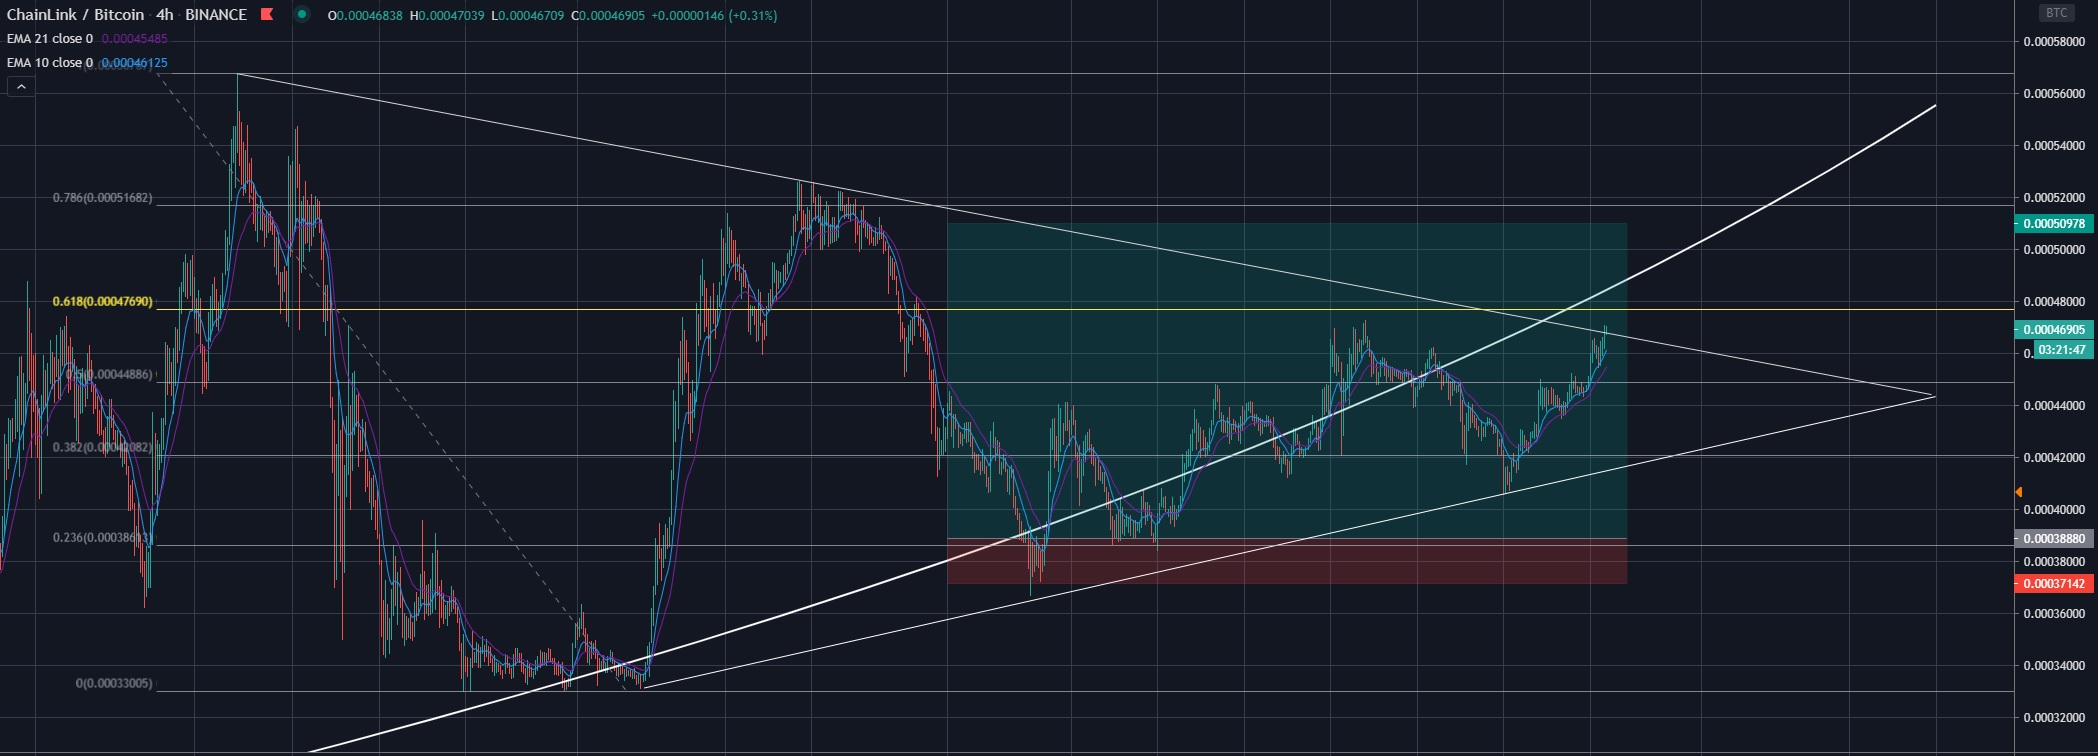
The price just hit the original resistance line I had drawn which also happens to come close to the 0.618 Fibonacci golden pocket zone and I sold my position.
Buy Price: 0.0003875 BTC
Sell Price: 0.00046850 BTC
Profit Margin: +20.9%
Time Window: 47 Days
Moving Forward
Link is still very much keeping the support line and looks like it wants to go up more from here on out. I will continue keeping an eye on it and probably take another trade the moment it hits the parabolic line the next time with a tight stop loss. If it ever gets broken I will likely sell 25% of my Hodl position hoping to buy it back at a cheaper price in case it drops.
Lessons Learned
I really learned a lot and from now on, I will always adjust the lines and patterns based on what the chart is doing instead of having them fixed disregarding new info. Basic "buy the support & sell the resistance" setups seem to be quite tradable for a beginner like me and I will put more of my focus on them trying to find similar spots like this in the near future. Also like they say, the trend is clearly your friend and I guess I'm less scared about charts that go up and will be way more cautious trying to catch the bottom on coins that are in a downward trend.
| Trade | Status |
|---|---|
| Documented Trade #1 Chainlink | Complete +20.9% |
| Documented Trade #2 Bitcoin | Complete +0% |
| Documented Trade #3 | Soon |
I will also continue to make a summary of everything I'm learning about Technical Analysis in easy to understand bite-sized pieces
Technical Analysis Lessons
Technical Analysis #1 | Basics
Technical Analysis #2 | Trends
Technical Analysis #3 | Bearish Patterns
Technical Analysis #4 | Bullish Patterns
Technical Analysis #5 | Symmetrical triangles
Technical Analysis #6 | Volume Indicator
Technical Analysis #7 | Moving Averages
Technical Analysis #8 | MACD
Technical Analysis #9 | RSI
Technical Analysis #10 | Fibonacci Retracements
Free Software I use for Charts
Tradingview
Free Software I use for Trading
Binance
|
|
|
|


Posted Using LeoFinance