Bitcoin (BTC / USD) Up or Down? Why the price of Bitcoin does not seem to move?
Today we see that the price of bitcoin lateralizes in a short range, which seems not to be decided, but the price may be telling us something
We compare 2020 with what happened in 2016
Let's see
Sometimes you have to see what happened in the past to estimate what might happen with the price.
Why 2016?
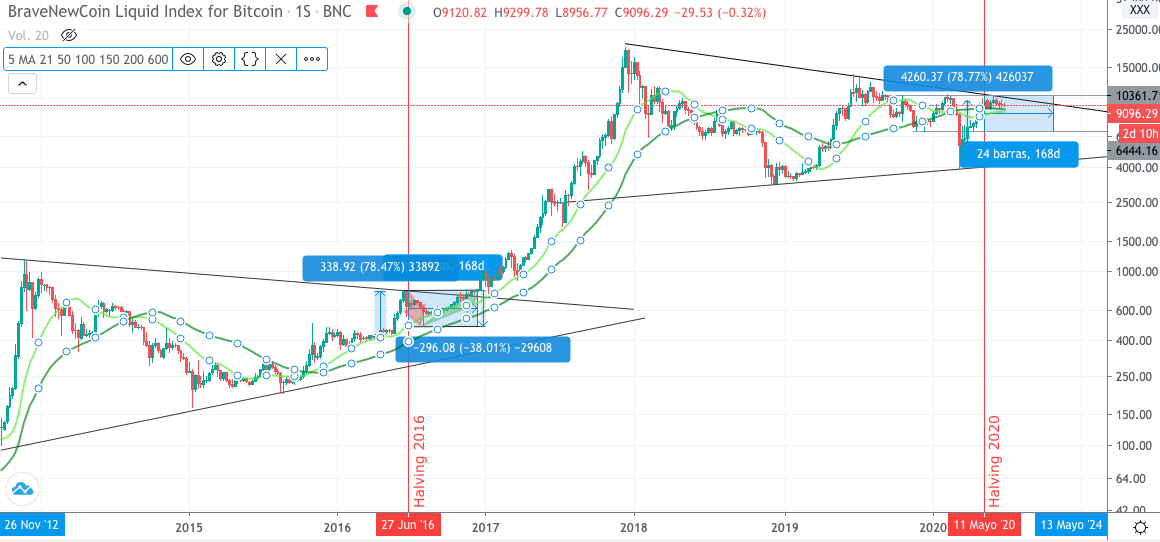
Because comparing the price movements we see the formation of triangles and in 2016 and 2020 we see that the price is approaching the upper limit.
Analysis year 2016
Pre halving
A few months before Halving 2016, we see that the price in its last bullish cycle increases the price by 78%, analyzing in weekly charts and considering the body of the candles.
In general, when the price makes bullish changes in a few days, it normally takes weeks or months to continue the trend and is healthy for the market.
Post Halving
As we see in 2016 after halving, the price has been in a side channel for 168 days where it has made a correction after losing the 50-period MA line, daily chart.
That is why it is important for Bitcoin to keep the price above the 50-period average daily line, daily chart.
It took 168 days to get past this side channel, but over the course of that time it has broken the triangle bullishly
During this period, it has again gained the 50-period median line and the price has continued to rise
Analysis 2020
Pre halving
A few months before Halving 2020, we see that the price made a great correction, as a result of the global crisis, economic and health, and then, in its bullish cycle, the price rises 78%, analyzing in weekly charts and considering the body of the candles repeating what happened in 2016.
Post Halving
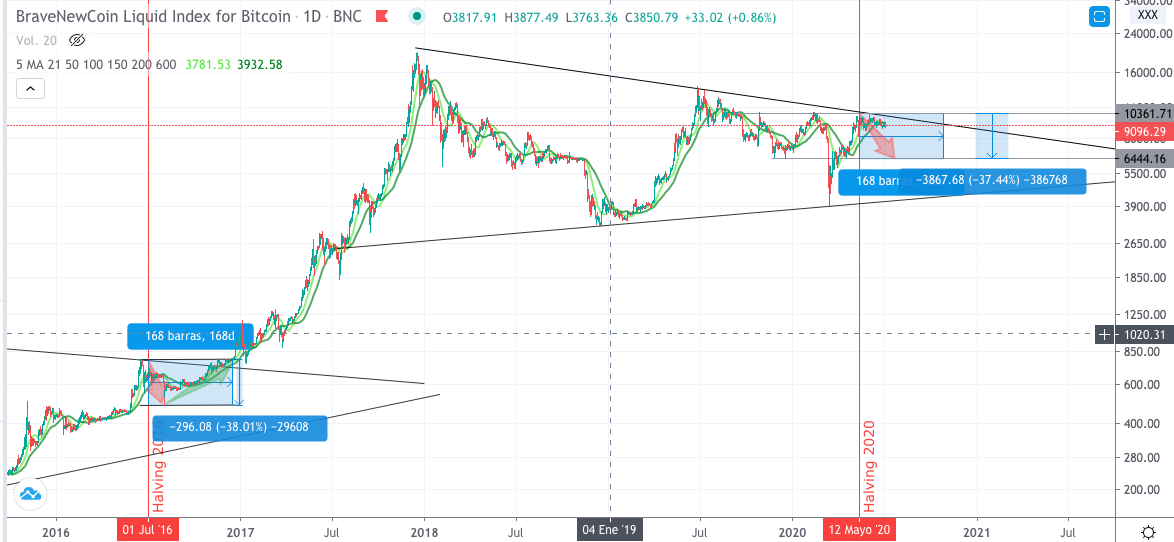
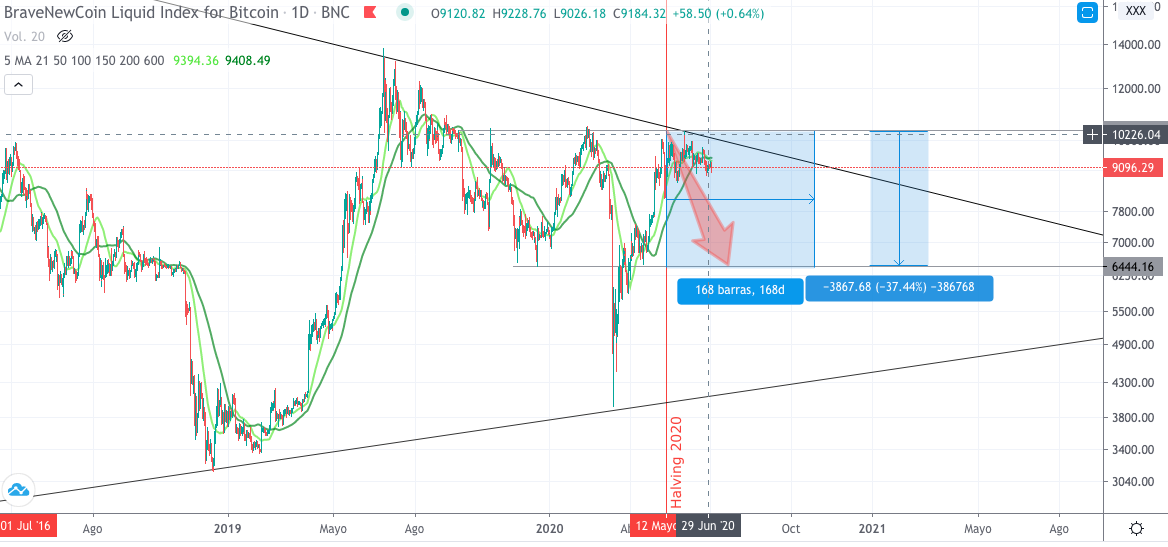
The price after halving fails to break previous highs and the price lateralizes. 15 days ago, Bitcoin breaks the 50-period daily average line, daily chart.
It is normal that in the face of a rise in the price of Bitcoin going from $ 4,000 to $ 10,000 there is a lateralization as what happened in 2016 and a correction of the price in the interval of a few months after halving
Compared to 2016, the drop from the maximum after Halving was 38%, if repeated in 2020, it could take the price to approximately $ 6500 dollars.
After a few months, the price should break the triangle at the top to start the post-bull cycle in half if we repeat the post-process in mid-2016
What you think? Could we see in the coming months a lateral price due to indecision, due to the global crisis and repeat what happened in 2016?
Remember to give your post a vote, Always support good content. ThanksFollow me it costs you nothing and you get a Healing Reward with Your Vote

Protect your assets use Stop loss
The alcoins market is very dependent on the price of Bitcoin, when Bitcoins goes up the alcoins go up more, but also in the other sense, so I suggest that you periodically review a Bitcoin and use stop loss and move it when they are already in profit. Do not let a profit become a loss.
We will continue monitoring
To be attentive
Protect your Investments
Feel free to use and share my post or graphics, but please mention, @criptoar as the author. Otherwise, consider plagiarism and I will call you and advise my friends to do the same.
READ DISCLAIMER: this publication / analysis is only for general information purposes. I am not a professional trader and I will never be a financial advisor. The material in this publication does not constitute any trading advice of any kind. This is the way I see the paintings and what my ideas are.
Perform your own analysis before making an investment decision. Use money that you are willing to lose if you make an investment.
If you make exchanges or investments after reading this publication, it is entirely at your own risk. I am not responsible for any of your gains or losses. By reading this publication, you acknowledge and agree that you will never hold me liable for any of your profits or losses.

For your vote or comment, thank you
Funny you're writing about this, I covered the exact same topic in my weekly post.
Personally I don't really see the point of comparing today's spot price action to charts from 2016, the market structure has changed a lot in 4 years, mainly because we have a derivatives market that produces more volume than spot and very thin spot market as a result of the halving and most BTC being hoarded on cold storage.
Charts itself won't tell you that story, gotta dig deeper.
Sorry but I don't read your posts. I do my own analysis
Uh, I am not saying you copied my post, come on dude.
What about the rest of my comment, the bit about markets being completely different since 2016... any comment about that?