2 hours BTC chart analysis
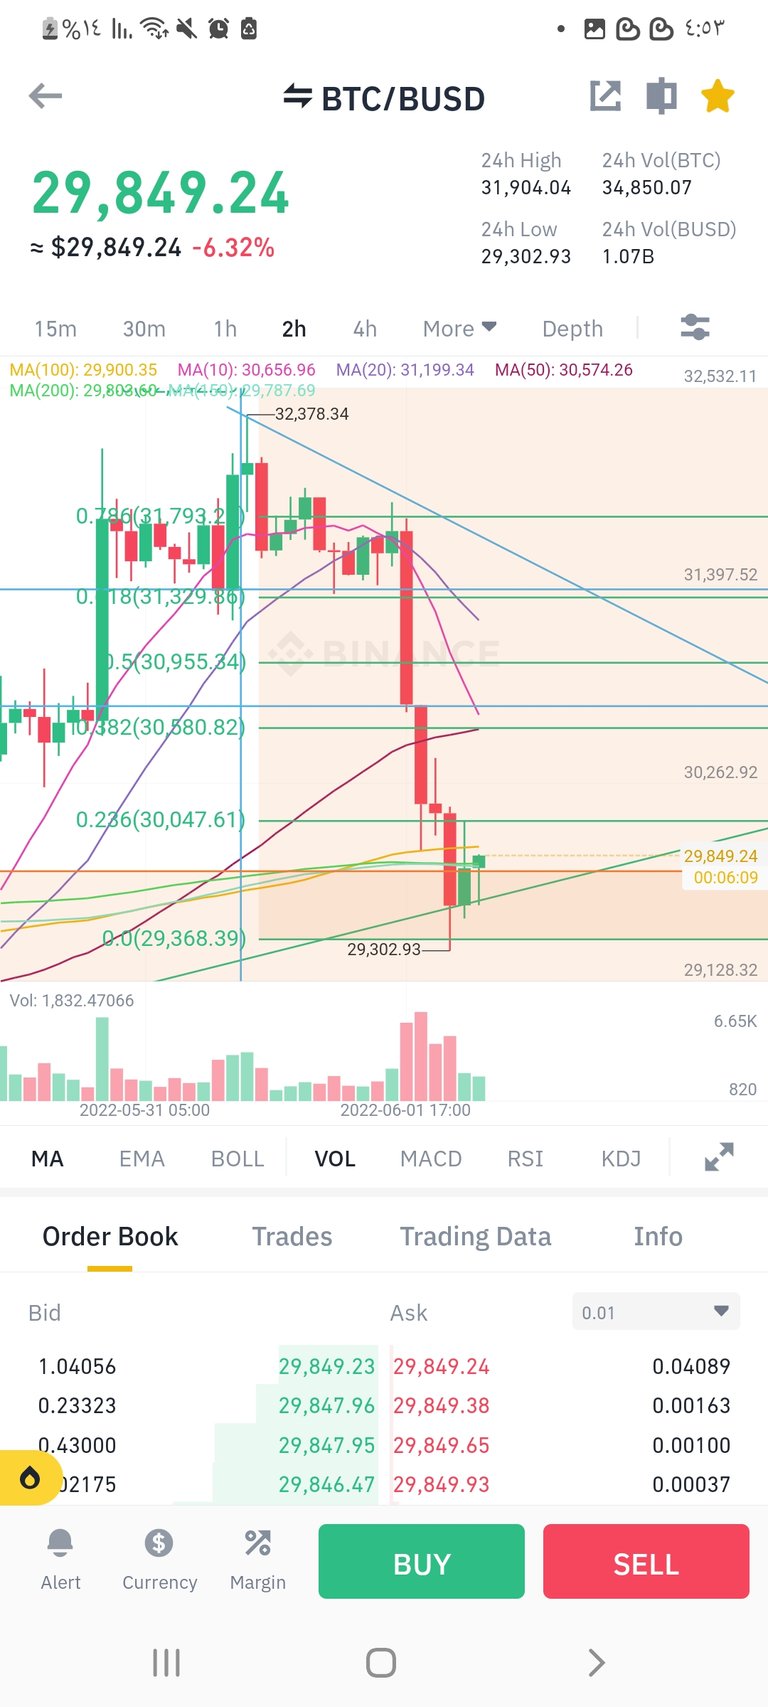
Bitcoin corrected the bullish trend to the level of the 29k area, which is a demand area, and now it is possible to correct the downtrend in the past hours. We need to close above 30k, an area that may form a symmetrical triangle. The bearish trend rebounded from the upward trend line. We will see an area maybe 30100, which is the Fibonacci line of 23.6%, then the area of 30500, which is the Fibonacci line of 38.2%.
The candle of the last two hours is good representing the hummer.
But be careful area 29300 to 29920 is demand area.
We will see the situation tomorrow..
بتكوين قام بتصحيح الترند الصاعد الى مستوى منطقة 29k وهي منطقة طلب ، وهو والان محتمل تصحيح الترند الهابط في الساعات الماضيه نحتاج اغلاق فوق 30k وهي منطقة ربما تشكل مثلث متماثل ، ارتد الترن الهابط من خط ترند للاعلى . سنرى منطقة ربما 30100 وهي خط فيبوناتشي 23.6 % ثم منطقة 30500 وهي خط فيبوناتشي 38.2% و شمعة الساعتين الماضية جيد تمثل هامر .
سنرى الوضاع غدا ..
it seemed that Bitcoin had recovered instead it underwent another strong selling phase
Yes I think so too !PIZZA
PIZZA Holders sent $PIZZA tips in this post's comments:
@cryptohaytham(3/5) tipped @stefano.massari (x1)
You can now send $PIZZA tips in Discord via tip.cc!
!hivebits
Success! You mined .9 HBIT & the user you replied to received .1 HBIT on your behalf. mine | wallet | market | tools | discord | community | <>< daily