Weekly on chain analysis - a new beginning (?)
Glassnode data this week seems to indicate that we have finally arrived at a "capitulation" phase, i.e. that typical bear market acceleration that precedes an upward trend reversal.
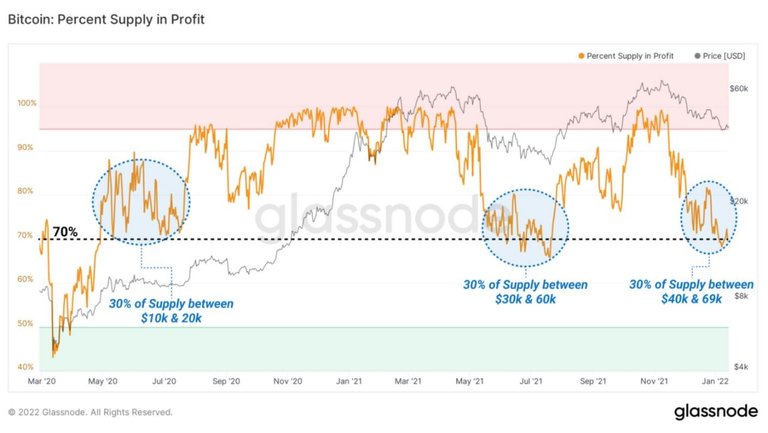
The continuous descent of prices is increasing the number of coins (BTC) that are at a loss, because they have reached a price lower than their purchase price.
The circle on the far right indicates that the percentage of these losing coins has reached values similar to those it had on two previous occasions in the last two years (the other circles in the graph) and that had preceded a subsequent rise.
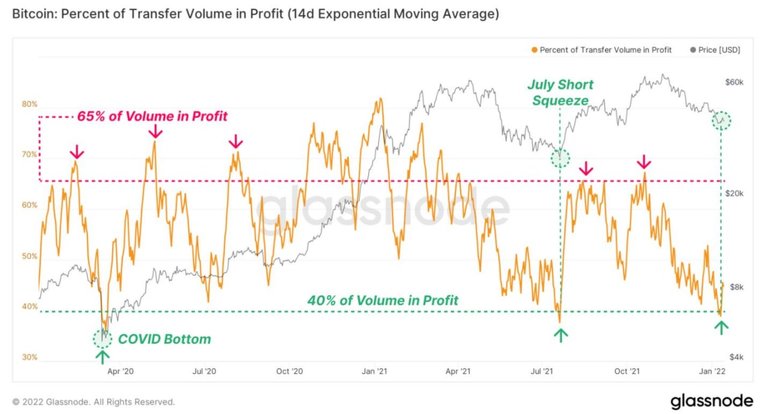
But the metric that more specifically indicates "capitulation" is this: the percentage of spending volumes in profit (my non-literal translation).
This metric indicates how many of the coins spent lately are in profit.
The current value, less than 40%, indicates that those who had bought BTC in 2021 and had not sold so far are starting to sell their coins at a loss, scared by the continued declines.
The metric is nothing more than a way to measure a rapid change in the "sentiment" of mid-term holders, who are beginning to lose confidence in the market.
It does not differ much from the "fear index" that we saw on January 15 and that confirms the hypothesis that we have arrived at an extreme phase, probably conclusive, of the bear market.
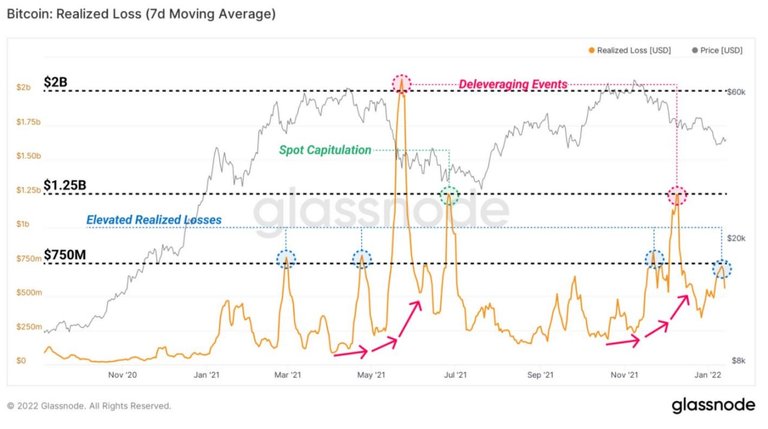
Note in this chart the analogy of the current trend of coin sales at a loss (yellow curve) with the trend that occurred between last May and July.
In both cases, we see an increase in loss-making sales (red arrows), followed by a progressive reduction of these sales.
The moment in which the reduction of sales begins to be more decisive indicates in practice that almost all those who could sell at a loss have done so and therefore there are not many other losses left to realize. Obviously, this also coincides with the beginning of a new uptrend.
At the moment we are not yet at this point, but we have passed the maximum level of sales (last red circle on the right) and we are descending the slope in the same irregular way we saw between June and July.
Afterward, the descent of the yellow curve will be sharper and will coincide with the beginning of a new bull market.
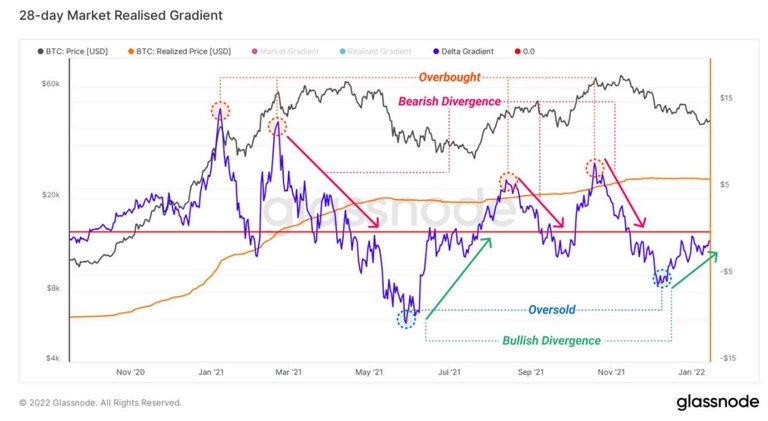
The market gradient (spread between the total market cap and the part of it that is in profit) instead already gives us an early signal of "bullish divergence" (green arrow on the far right).
A bullish divergence basically signals the approach of an equilibrium point between capital flow into the market and sales.
The red horizontal line signals the equilibrium point.
When the blue curve crosses this point, there begins to be greater capital flows buying the sold coins and supporting their prices.
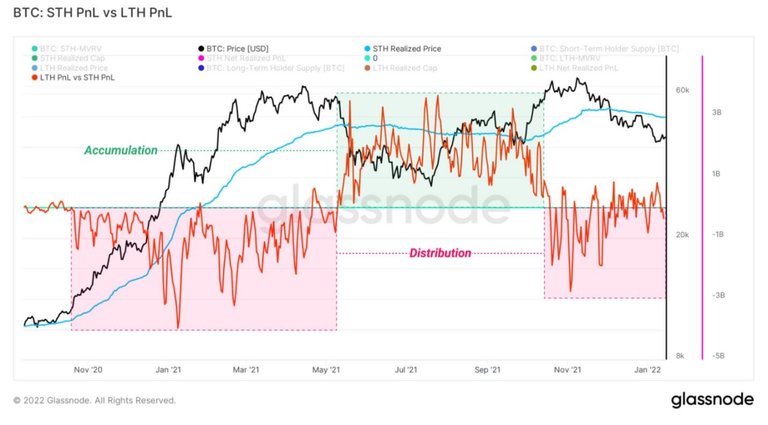
Even more clearly bullish is the ratio between the sales of holders (of medium term) compared to those of short-medium term traders.
The chart shows that we are already abundantly in a distribution phase.
In this phase, the same medium term holders that we have seen in the previous charts (those who have started the "capitulation" phase by selling at a loss without confidence in the markets) with this behavior actually "distribute", i.e. make available, these coins that will be the "fuel" for the next bull market.
Currently, (pink colored area on the far right), the indicator is slightly rising and trying to overcome the equilibrium point (green horizontal line) beyond which it will be able to develop a new bull market.
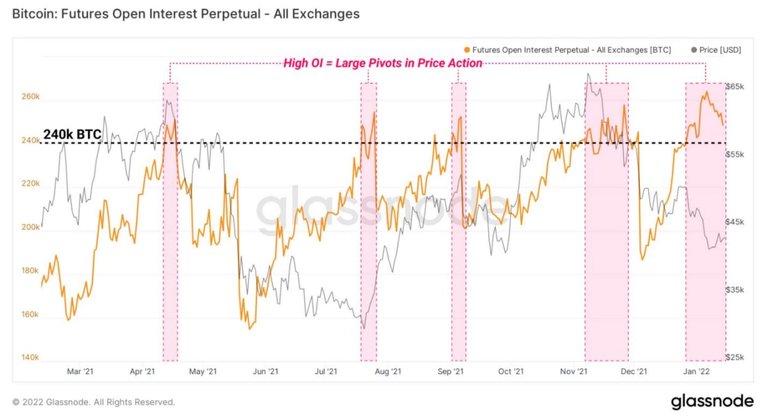
In the meantime, while the spot market goes through these crucial phases, in the derivatives the level of open positions is still very high, acting as a "powder keg" for possible short-term short squeezes (which we talked about last week) quite disconnected from the spot market that we have analyzed now.
At the moment Bitcoin is struggling to preserve the key area at $40K, while equity markets are under heavy pressure with the risk of a technical breakdown.
Let's see if Bitcoin manages to show the first signs of decorrelation or will be dragged down by the stock once again.
If the bearish have any ammunition left, this is the time to attack and try to hurt, however, I will not be scared off, the dynamics and signals coming from the market are very strong. My observations are obviously only observations and I refer to what happened in the past, however, no one is able to make certain predictions.
Thanks for reading.
Posted Using LeoFinance Beta
Yay! 🤗
Your content has been boosted with Ecency Points, by @cryptomaster5.
Use Ecency daily to boost your growth on platform!
Support Ecency
Vote for new Proposal
Delegate HP and earn more