Exchanges Transfers Report | Transfers to and from exchanges by date and accounts
The amount of HIVE on exchanges has been going up and down in the last year. Just recently we had a 3Speak snapshot for an airdrop and that has caused some HIVE moving around as well. Let’s take a look.
Here we will be looking at the transfers to and from exchanges in 2021, with a closer look at August.
Here we will be looking at the following:
- Daily and monthly transfers to exchanges
- Monthly transfers to exchanges
- Top accounts that deposited to exchanges
- Daily and monthly withdrawals from exchanges
- Top accounts that withdraw from exchanges
- Net deposits VS withdrawals
Exchanges taken in the analysis: Binance, Huobi, Bittrex, Upbit, Probit, Ionomy, MXC, Bithumb, Gate.io and Indodax. There are few more exchanges but the volume there is quite low.
Daily Transfers/Deposits To Exchanges
Here is the chart for the daily transfers/deposits to exchanges.
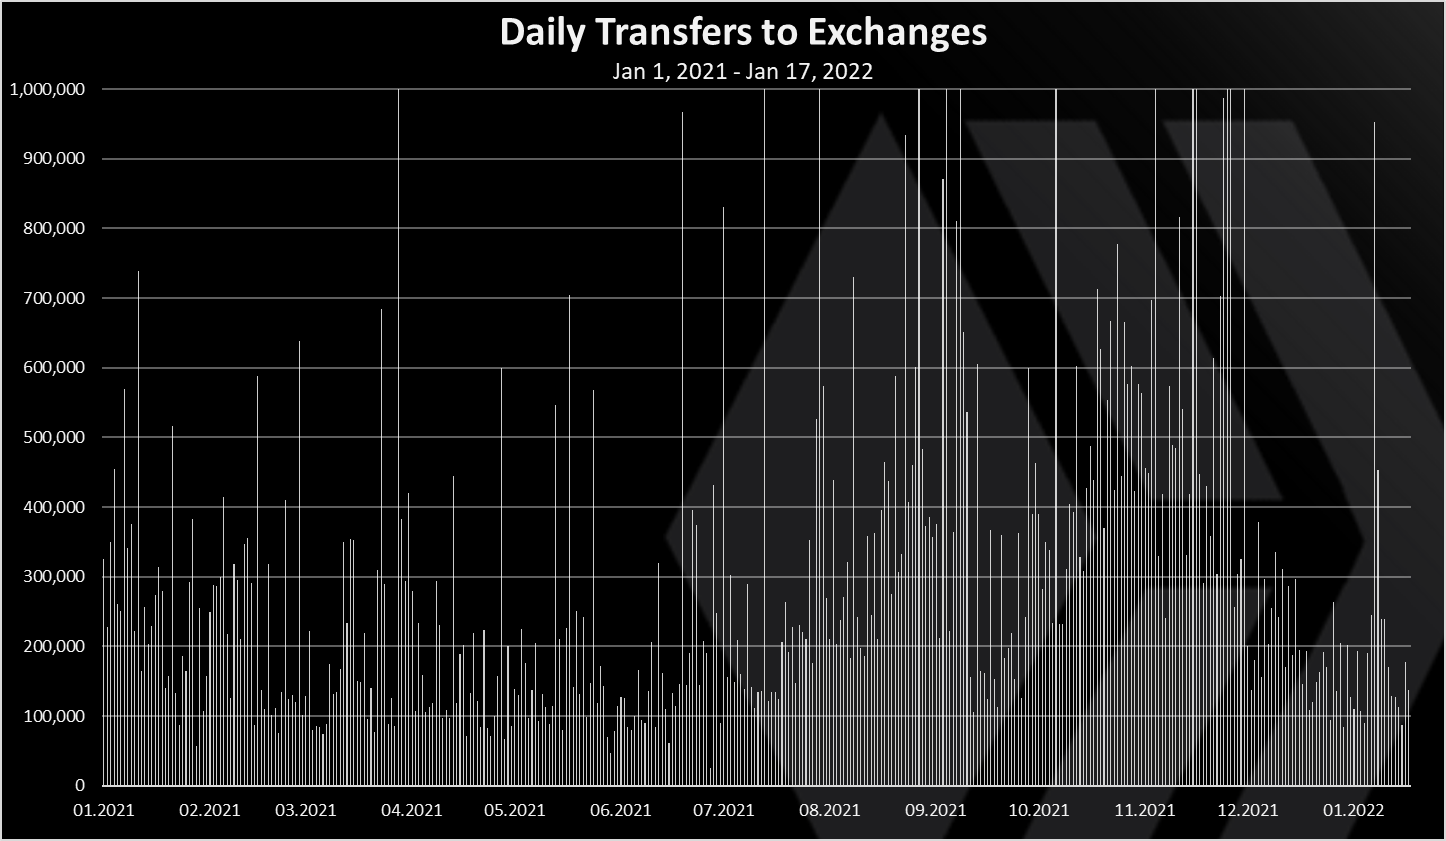
Note: Transfers between exchanges accounts are excluded from the data above.
It is hard to see the trend here because of the spikes, but overall, in the last months there seems to be some down trend.
If we look at the monthly chart we have this.
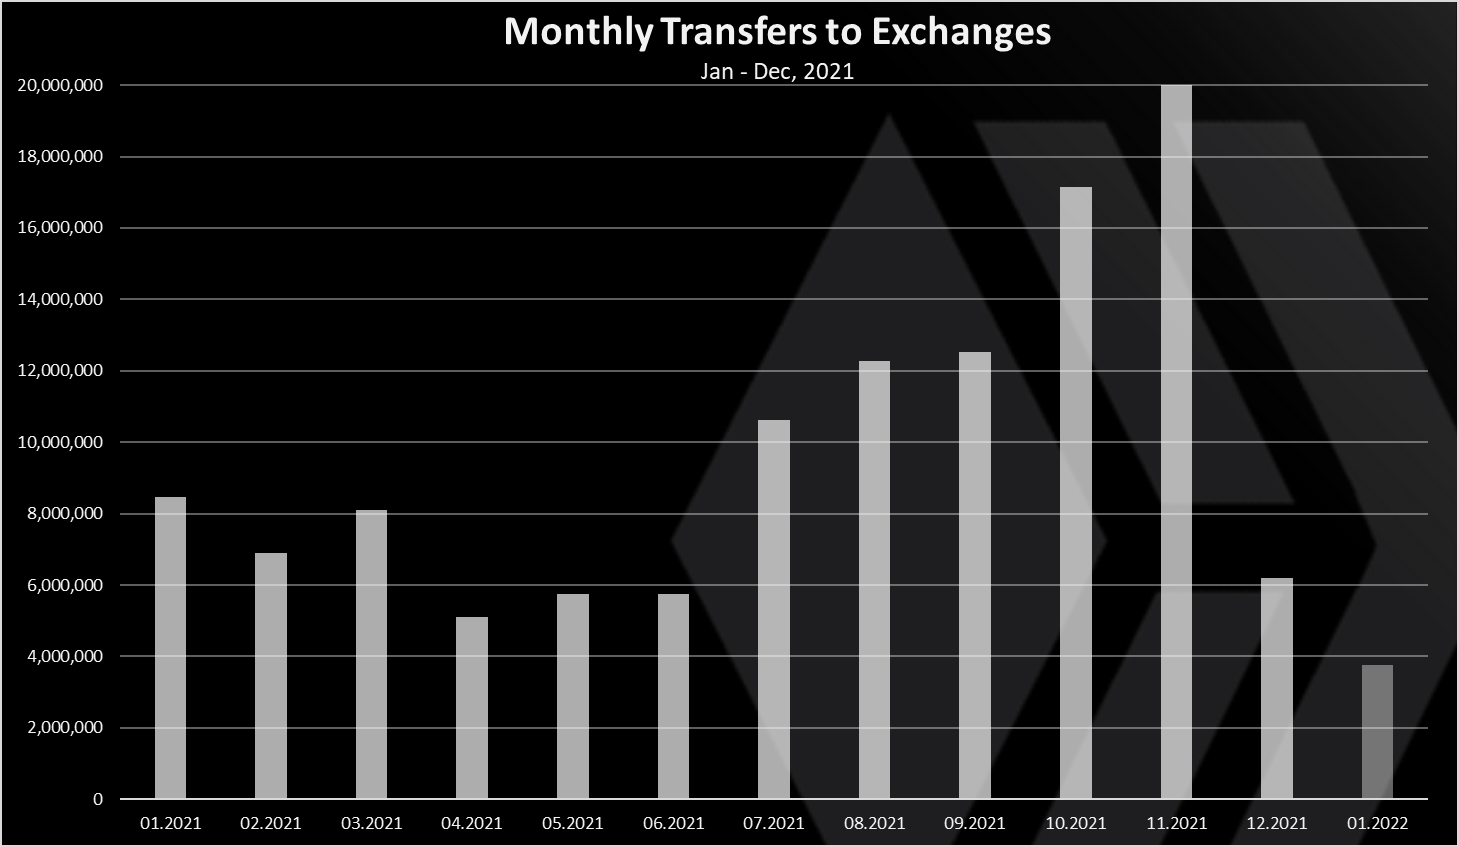
From here we can see the trend more easily. HIVE transfers to exchanges have been going down in the last two months. Note that January is not over yet.
In November there was a record high amount of HIVE transferred to exchanges with more then 20M, while December is around 6M, and January will probably end around the same.
Top Accounts That Deposited To Exchanges
Who has transferred the most funds to exchanges? Here is the chart for the last 30 days.
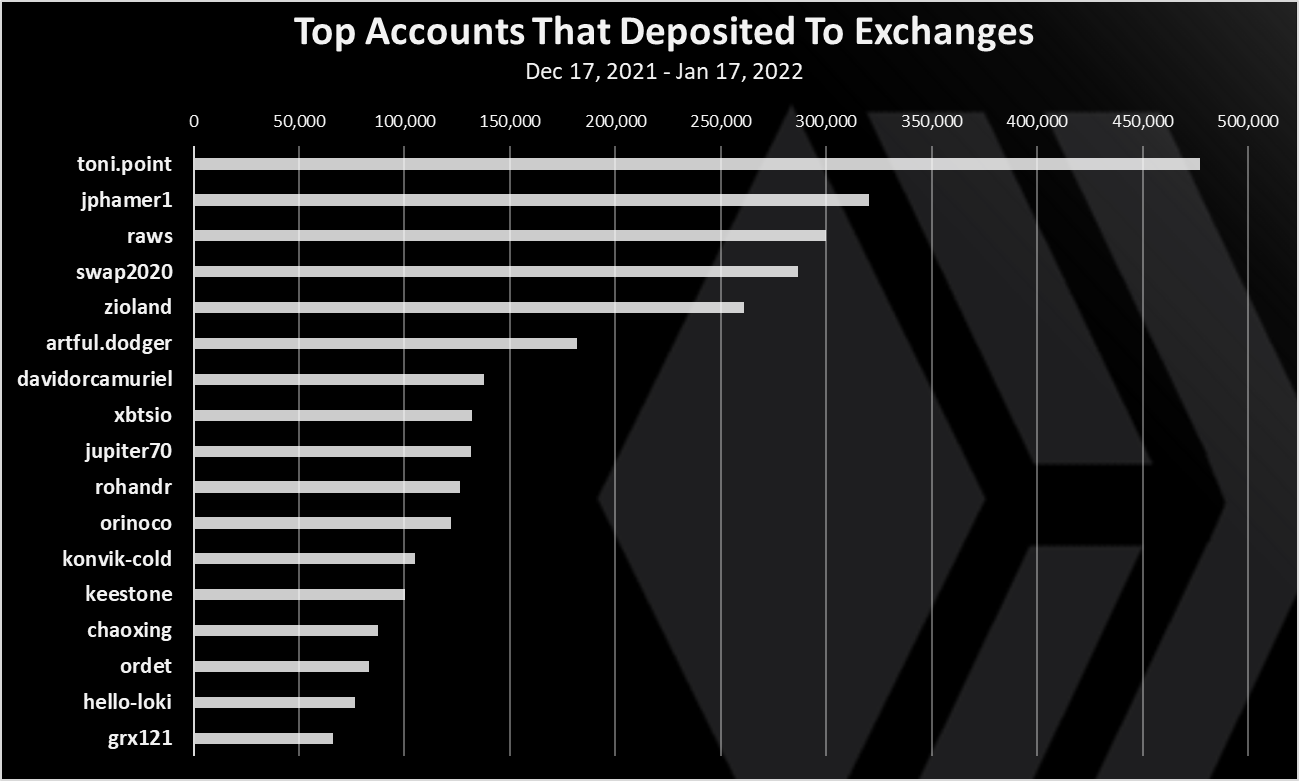
Note: exchange to exchange transfers are excluded. Those are usually the largest transfers.
@toni.pint is on the top here with almost 500k HIVE transferred. This is usually an arbitrage account. @jphamer1 and @raws on the second and third spot.
Daily Withdrawals From Exchanges
What about withdrawals from exchanges? How much is been withdrawn and by who?
Here is the chart for the daily withdrawals to exchanges.
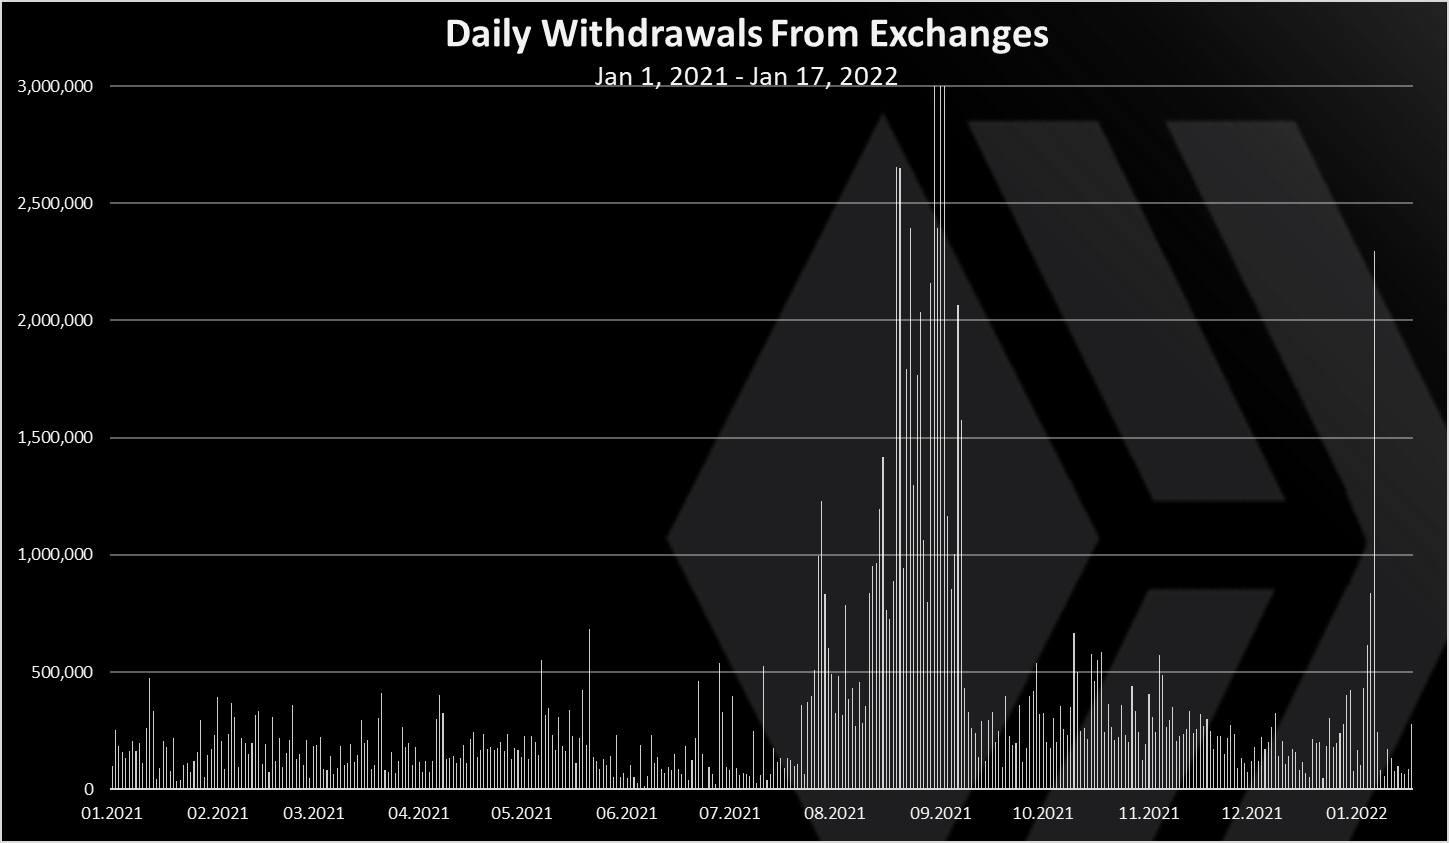
As for the above, here as well the transfers between exchanges accounts are excluded.
We can see the big spike toward the end of August 2021, and then one more daily spike with more than 2M withdrawn in a day in January 2022. This one is probably caused from the 3Speak airdrop.
The monthly chart looks like this.
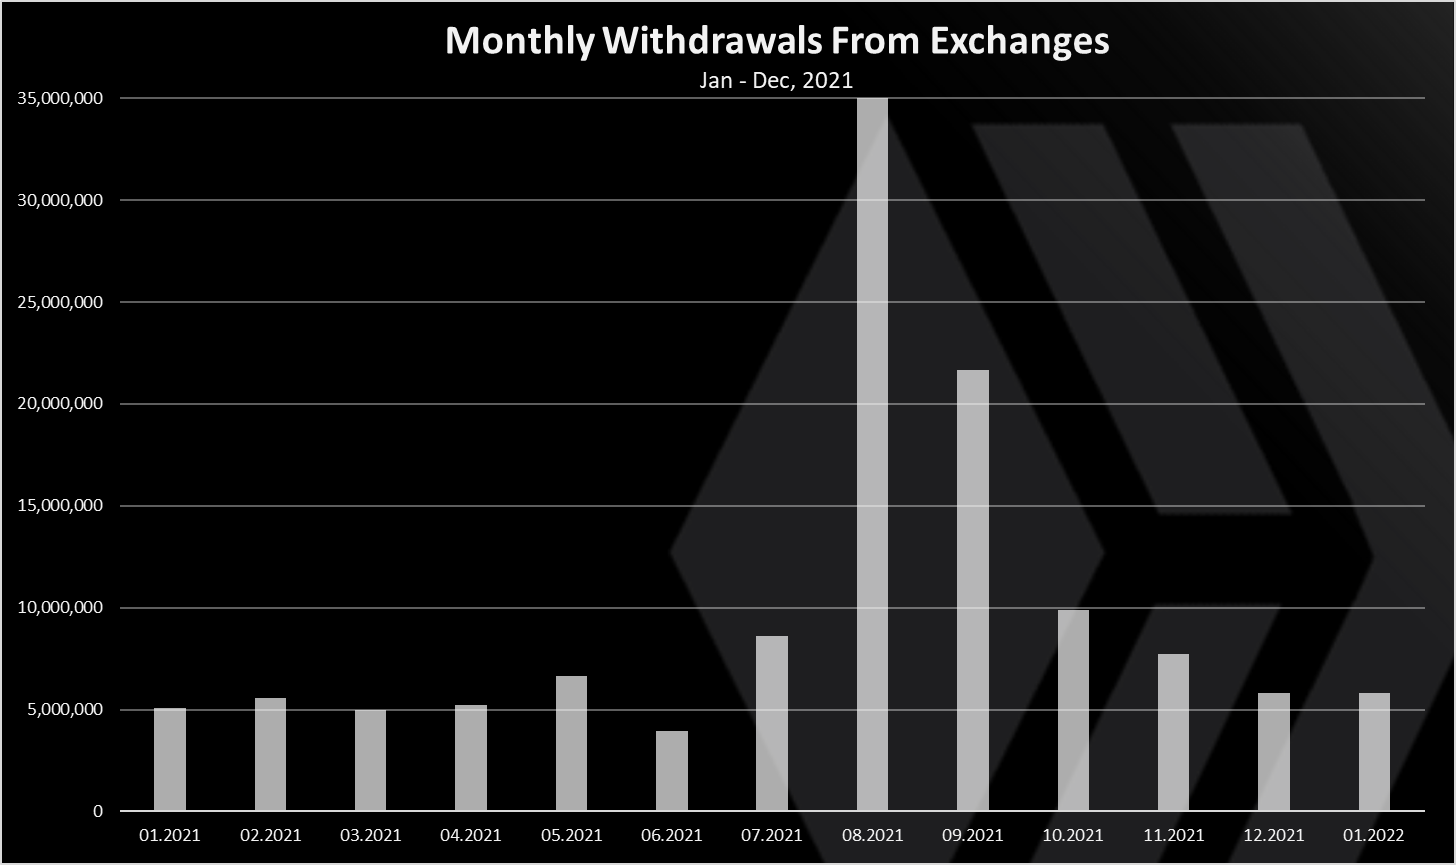
August is dominating the chart with 37M HIVE withdrawn from exchanges. Quite a big number 😊. December 2021 and January 2022 with around 6M.
Top Accounts That Withdrawn From Exchanges
Who has withdrawn the most funds from exchanges? Here is the chart for the last 30 days.
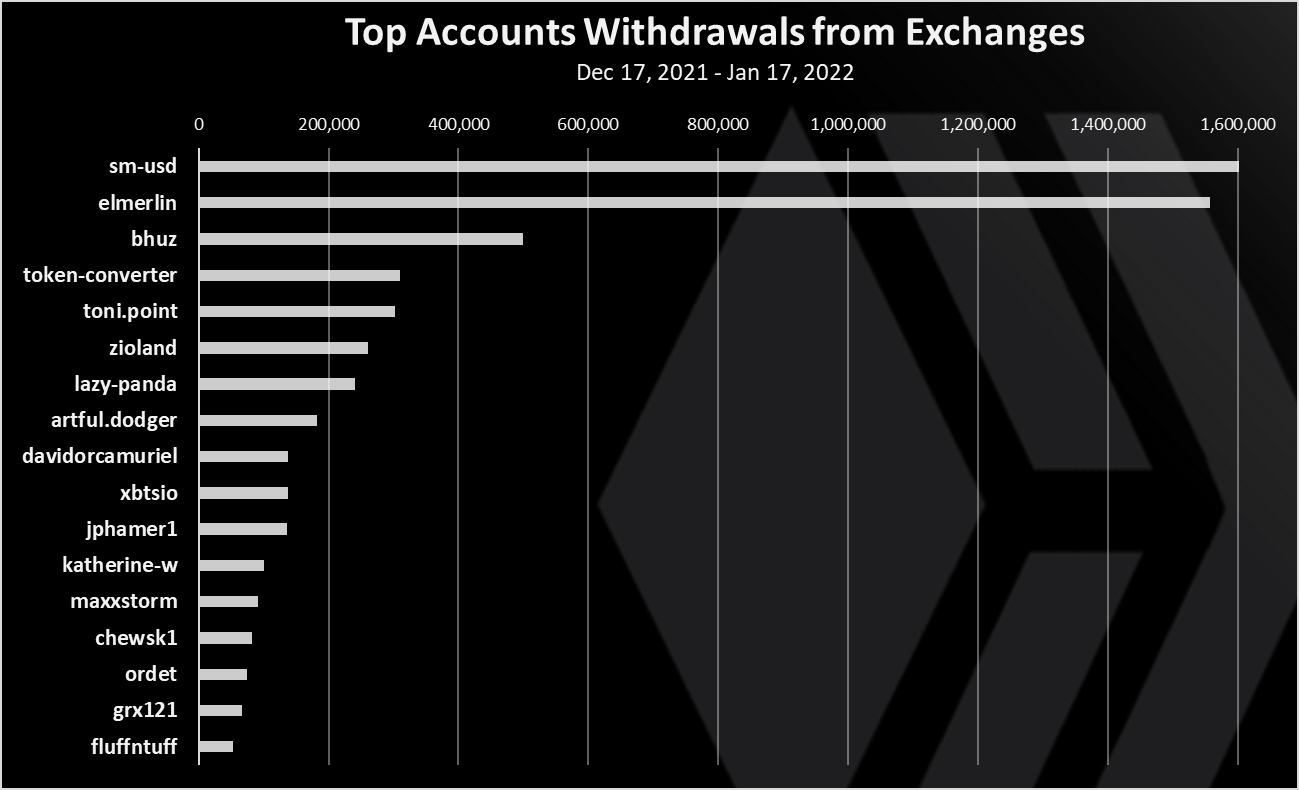
The @sm-usd on the top here with 1.6M HIVE withdrawn in the period. This seems to be a Splinterlands account. @elmerlin is next with more then 1.5M HIVE withdrawn. This account seems to be connected with the new liketu project on Hive, that is an Instagram like app.
Net Deposits VS Withdrawals
The net deposit vs withdrawals chart looks like this.
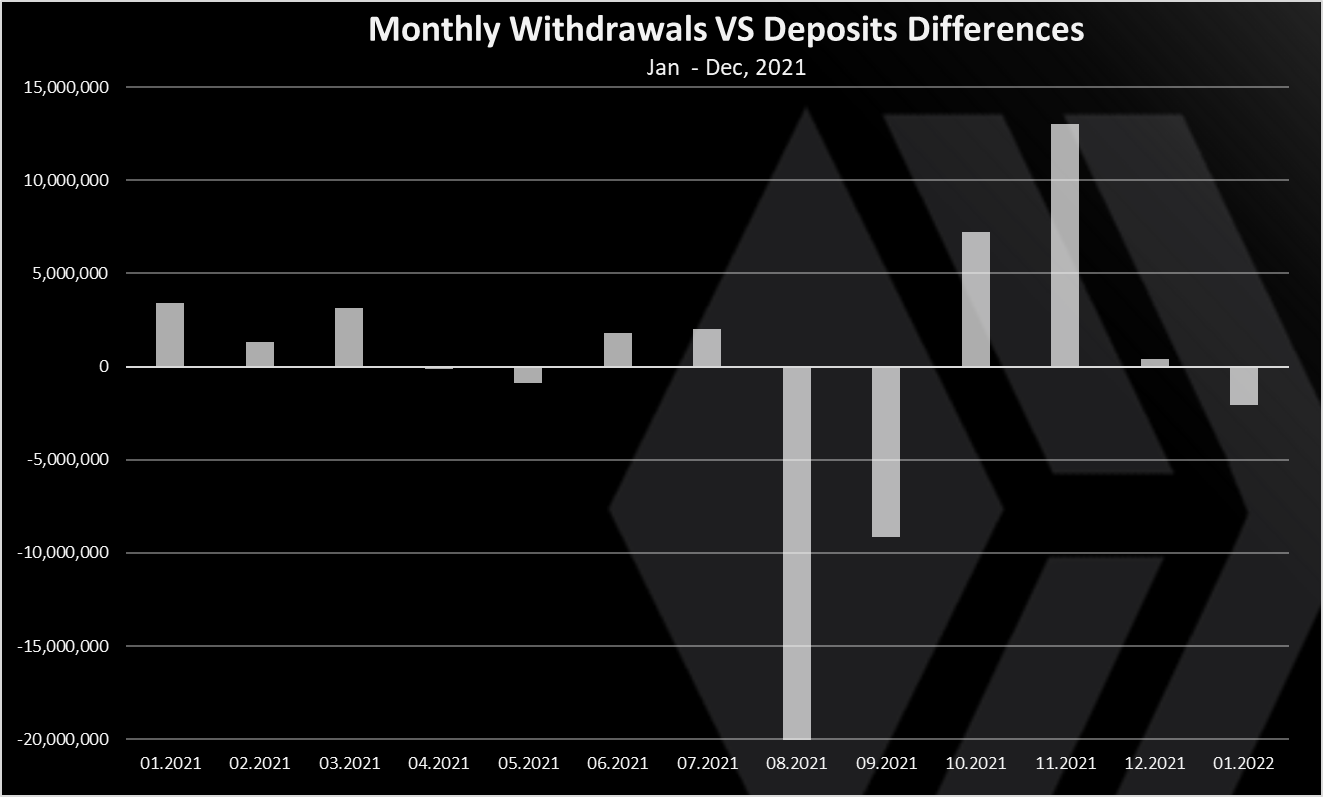
As for the other chart here as well transfers between exchanges account are excluded.
Positive bar means more funds are withdrawn from exchanges on that day, negative bar is more funds deposited to exchanges.
A total of 24.5M HIVE net withdrawn from exchanges in August 2021. This trend has continued in the first days of September as well. November has been a record high for deposits to exchanges. This is like an aftereffect after the large amounts withdrawn in the previous months and the conversions from HIVE to HBD.
December has been almost neutral and January 2021 is net negative for now, meaning HIVE is leaving exchanges.
When the Hive blockchain was created In April 2020 there was around 106M HIVE on exchanges. This number went up to more than 130M at one point. Mostly because of a lot of HBD conversions in 2020, but transfers from users as well.
In 2021 in September there was less then 100M on exchanges but then it went up again and now it is around 120M and it has been quite stable in the last two months.
All the best
@dalz
Posted Using LeoFinance Beta
https://twitter.com/Dalz19631657/status/1483393317194899461
The rewards earned on this comment will go directly to the person sharing the post on Twitter as long as they are registered with @poshtoken. Sign up at https://hiveposh.com.
The stability in the last two months has been really good, I think a lot of conversion from Hive to HBD will continue I don't exactly know it there will be a downside to this.
On chain HIVE to HBD conversions are a good thing. It doesn't really remove "value" from the system as a whole. For one, assuming the HBD is just held in savings, the HIVE is not causing selling pressure on the spot markets.
The only potential downside is too many people doing this and potentially losing the dollar peg of HBD if we have a drastic drawdown in the price of HIVE. There is a large buffer currently, and I think that threshold is also set to increase in subsequent hardforks.
Okay, thanks for that vivid explanation, I wouldn't have even thought about it. Looking at the potential downside, it doesn't seem this might be happening
I think that the data you represented is quite critical. Because as seen in the following chart there is an inverse relationship between Hive price and circulating supply. (I am not sure if Messari's data is correct. As I learned from your posts calculating Hive's supply is quite tricky)
Source: https://messari.io/asset/hive/chart/sply-circ
Hey this is quite interesting :)
From the first look it seems that they are tracking the virtual hive supply (HIVE + HBD converted to virtual HIVE at current prices), probably saving states from some of the hive apies.
Well, the snapshot caused the price of Hive to be stable to an extent because there was more inflow than outflow. It is not surprising that this is the case after the snapshot
Great post, I shed a tear for the Hive, Hive Live 2 :D