Number of Hive Transactions By Category | Posts, Votes, Transfers and Custom JSONs
Hive has been going trough some increased activities and yet again Splinterlands is to blame. The number of transactions that the players from the game make has skyrocketed in 2021. This has been a great test to the blockchain as a whole, how can it handle increased number of transactions.
We will be looking in the numbers for activity, and not just in terms of posting but other activities as well, like votes and custom JSONs that are mainly driven by games.

Before we continue with the analysis just a note on the activities. Unlike the good old Bitcoin, that has only one operation (transfer coins), Hive has a lot of them.
Usually when talked about activity on the Hive blockchain a lot of the users have in mind posting and commenting. Here we will be looking in the top 4 activities on the blockchain:
- Posts
- Comments
- Votes
- Transfers
- Custom JSON operations
The above consist the majority of all the activities on the blockchain. The claim rewards operation also has a high number of activity, but we will leave out that one.
The period that we will be looking at here is through the whole of 2021.
Number of Posts and Comments
Although gaming is growing on the blockchain, blogging still remains the core activity and one of the key ways inflation is distributed. Users can blog about gaming as well 😊.
Here is the chart for the number of posts and comments on the Hive blockchain.
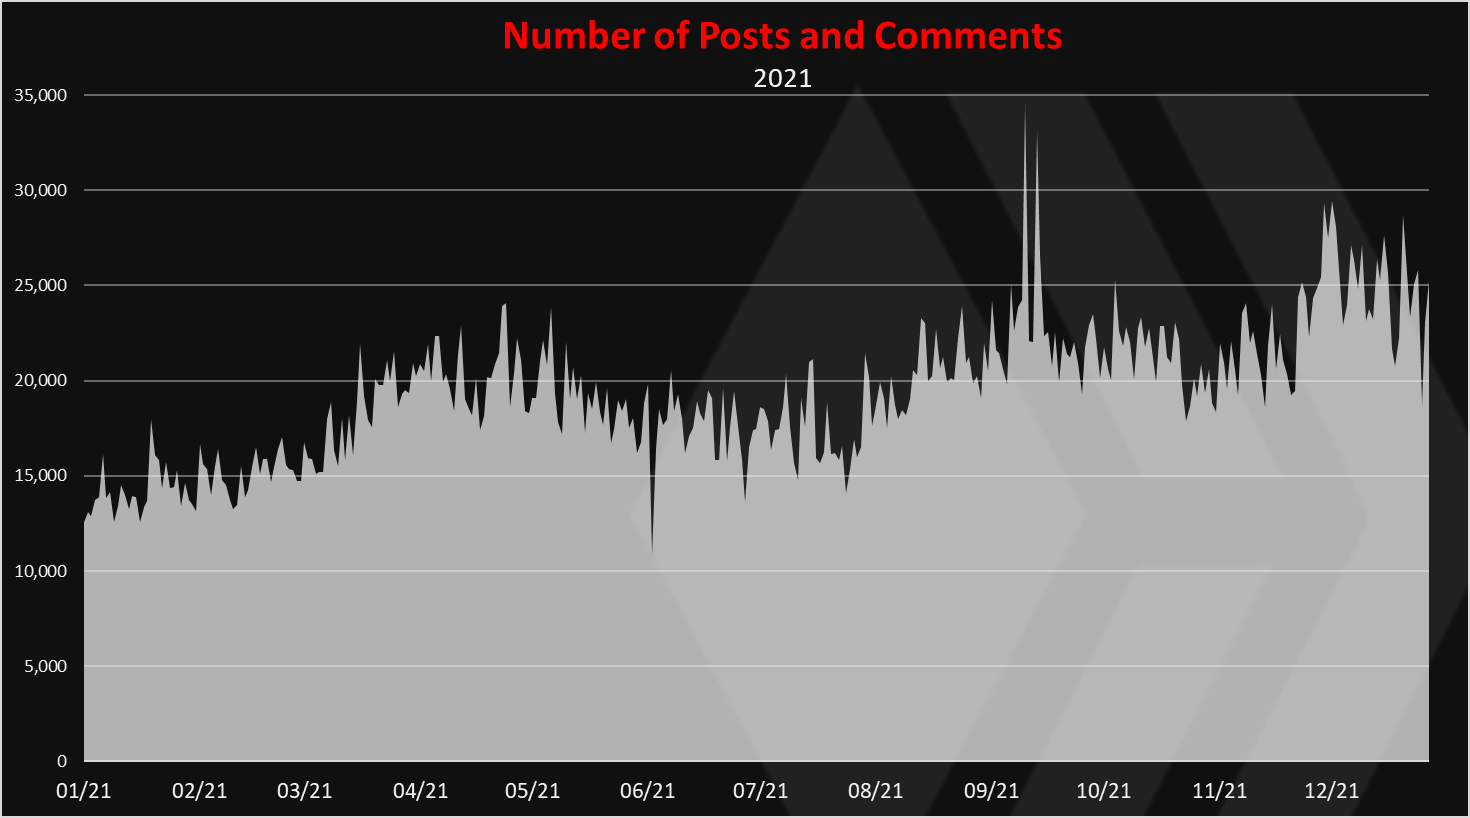
Overall a steady growth of posts and comments on the blockchain in 2021.
An increase in the numbers up until June, when the prices in crypto dropped. The summer has seen some drop in the posting activities as well. Then a growth once again towards the end of the year.
At the beginning of the year the number of posts and comments was around 14k and now it is around 25k.
Number of Votes
The chart for the votes looks like this.
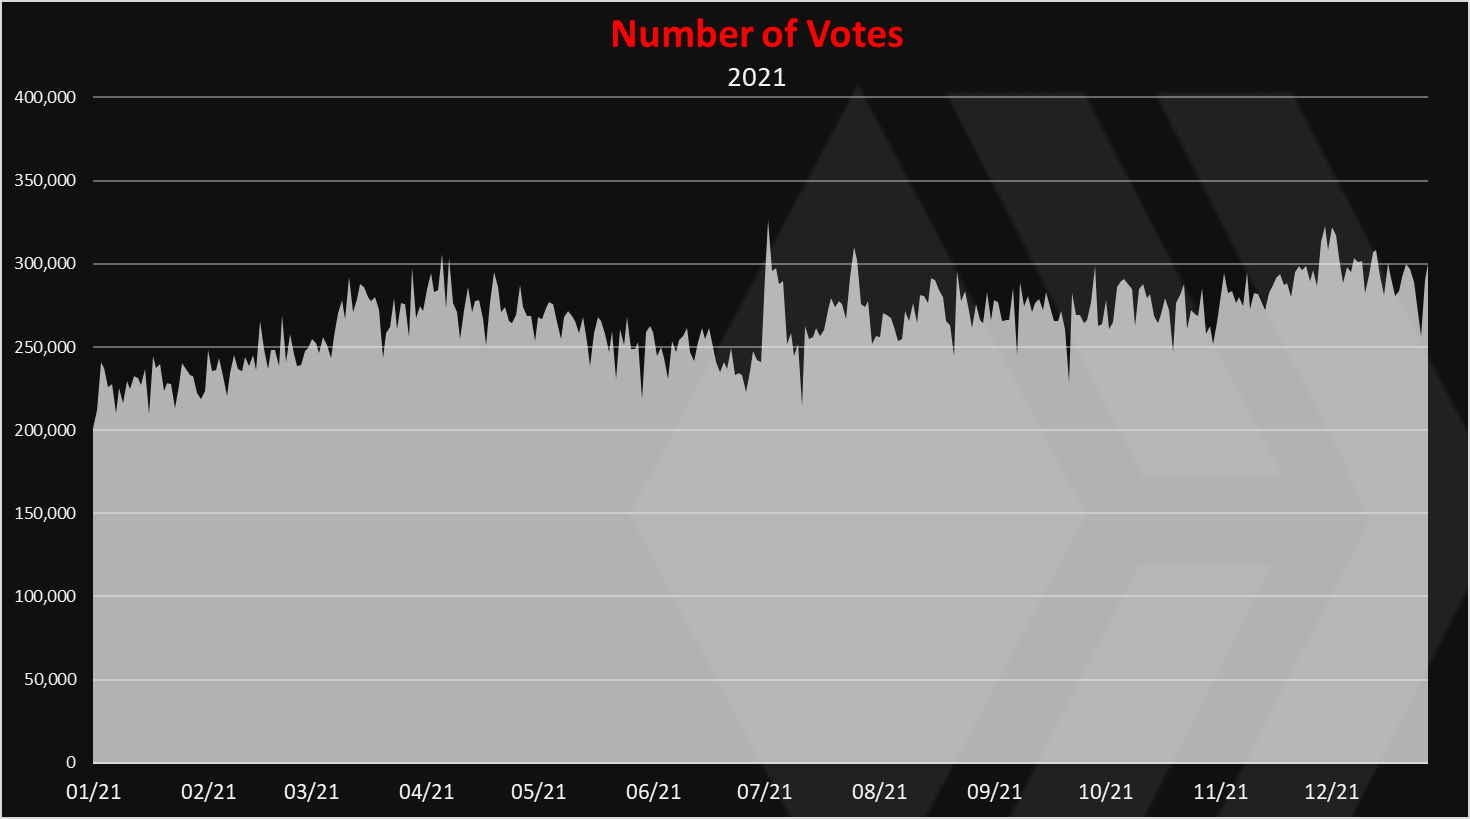
Votes are one of the core operations on the Hive blockchain. That is how the rewards are distributed. The Proof Of Brain mechanism (PoB) 😊.
The number of votes has been quite steady in the period, compared to the price volatility.
In the last period there is around 300k votes per day. On few occasions there was more then 300k per day.
Number of Transfers
The chart for the transactions looks like this.
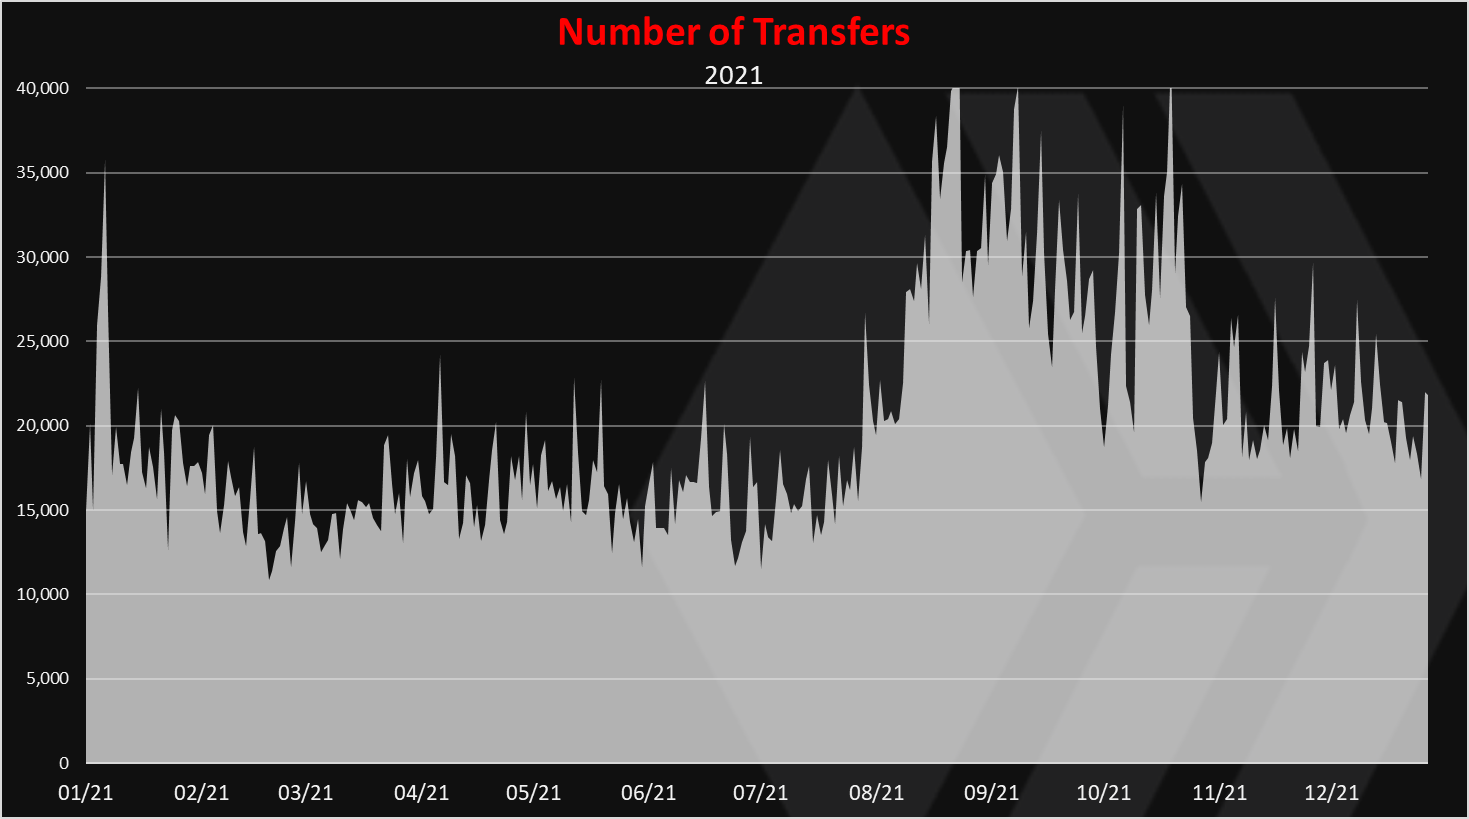
The chart for the transfers has seen some more volatility, especially at the end of August an in September this year. The year started with around 20k transfers per day, then it increased to 40k, and a drop to around 20k in the last months.
Number of Custom JSONs operations
The chart for custom JSONs operations.
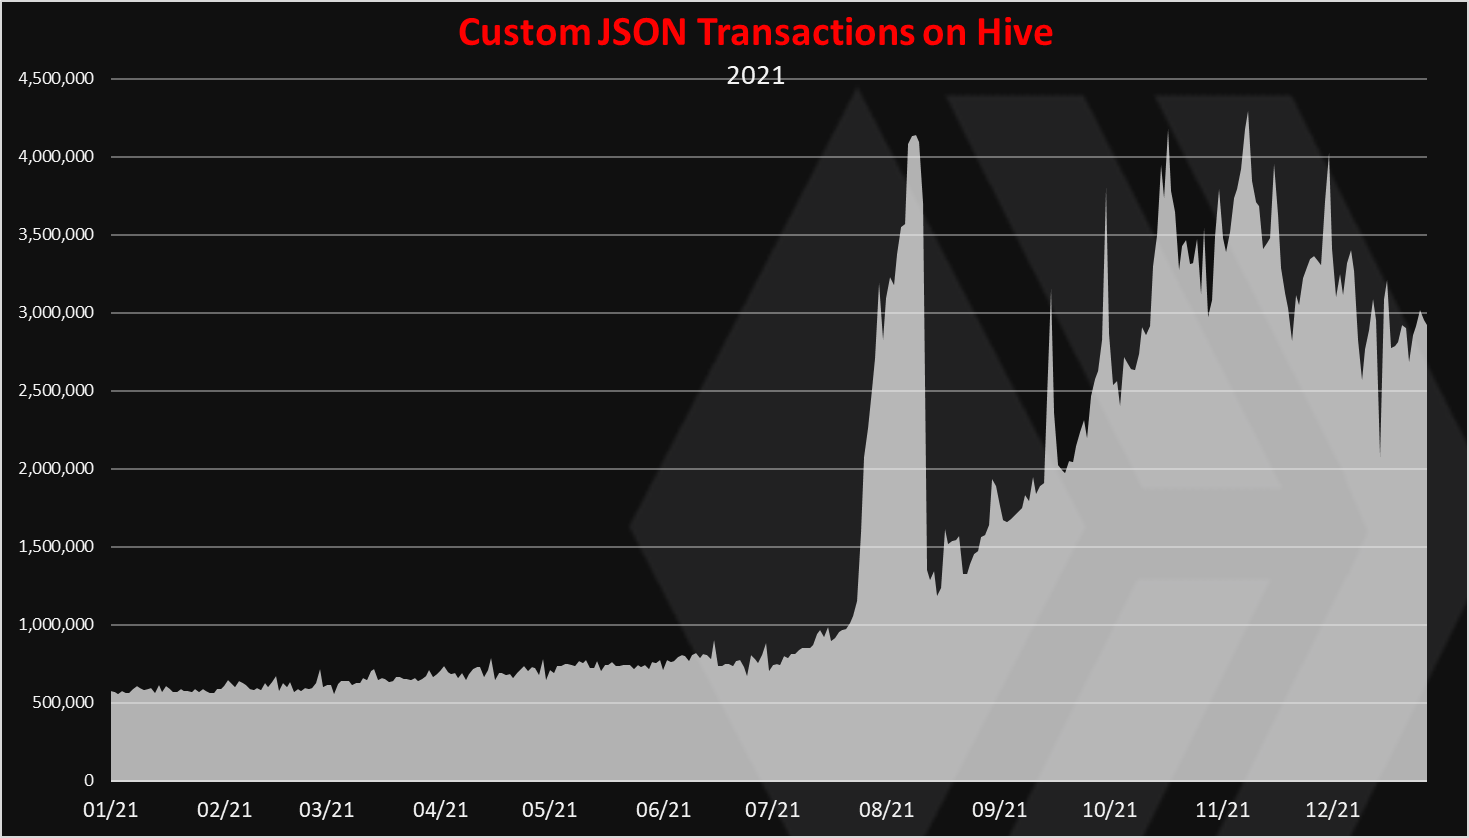
The custom json transactions are used mainly from the games on Hive, with Splinterlands on the top. Custom jsons are just a text files, but unlike the post and comments, they are like sidenotes, and don’t appear as post.
This chart shows the growth of Splinterlands the most.
It is an interesting one, because we can see the spike that happened in August, pushing the number of operations to more than 4M per day, and then a drop to 2M.
This is because Splinterlands has adjusted the way they store data on the blockchain, especially for the battles, resulting in less transactions. However even with these operations removed from the blockchain the overall operations continued and have reached 4M per day again.
Overall Activity on Hive
Well not quite overall but most of it 😊.
When we combine all the charts above, we get this.
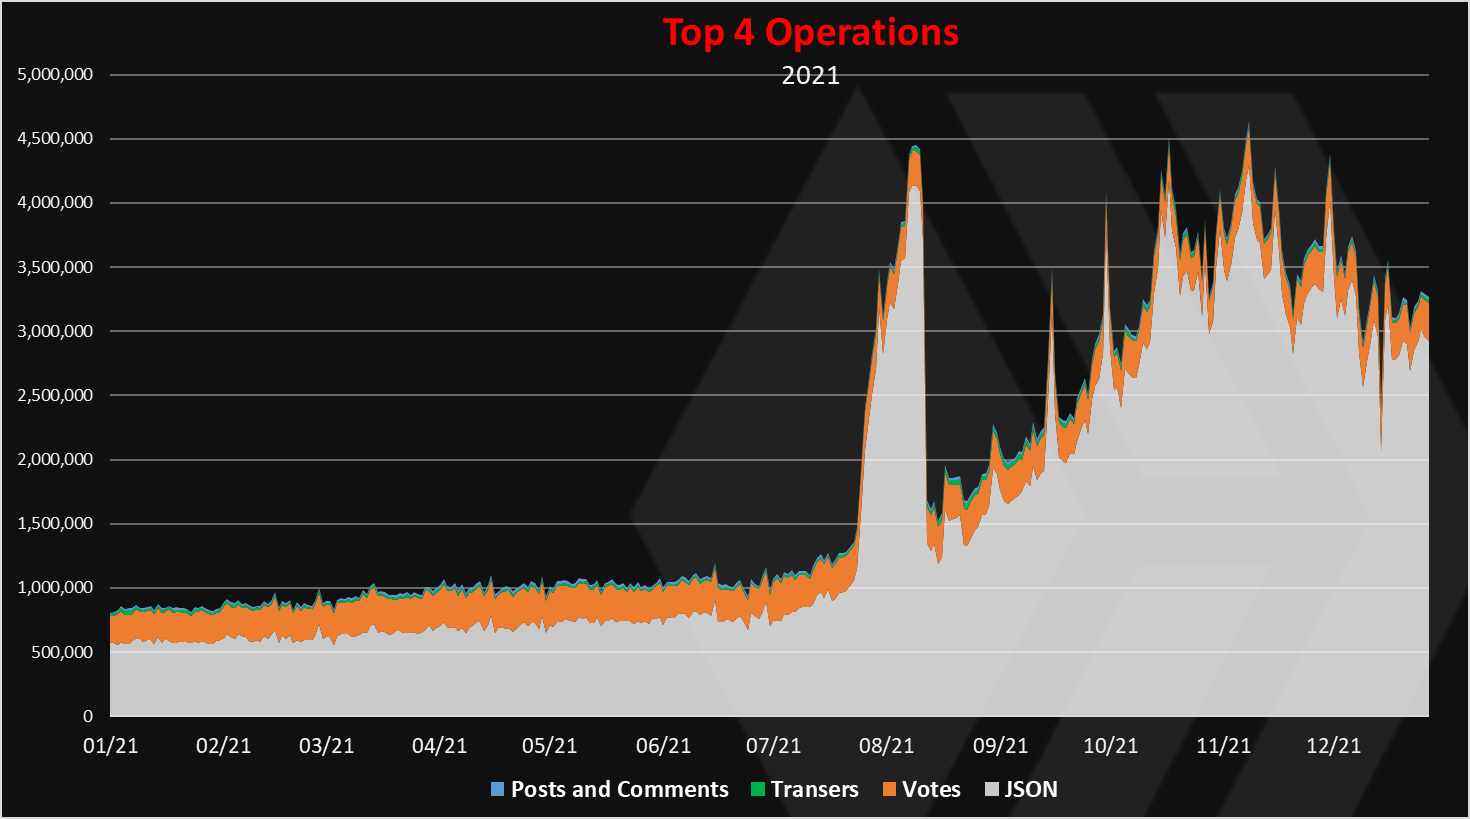
As we can see the custom jsons operation are now dominating the Hive blockchain. In the last period more than 80% of all the operations on the Hive blockchain are custom jsons.
Although we should mention that the “weight” of these operations is not the same, so its not totally comparable. Posts have the largest weight, as they require a lot of texts and effort, unlike votes or jsons, that are usually a one click operation.
Here is the table for the number of transactions per type for December 2021.
| Operation | Quantity |
|---|---|
| JSON | 79,888,378 |
| Votes | 7,952,948 |
| Posts and Comments | 670,959 |
| Transfers | 562,232 |
Number Of Transactions Per Month
The monthly chart presents a better overview of the transactions. Here it is.
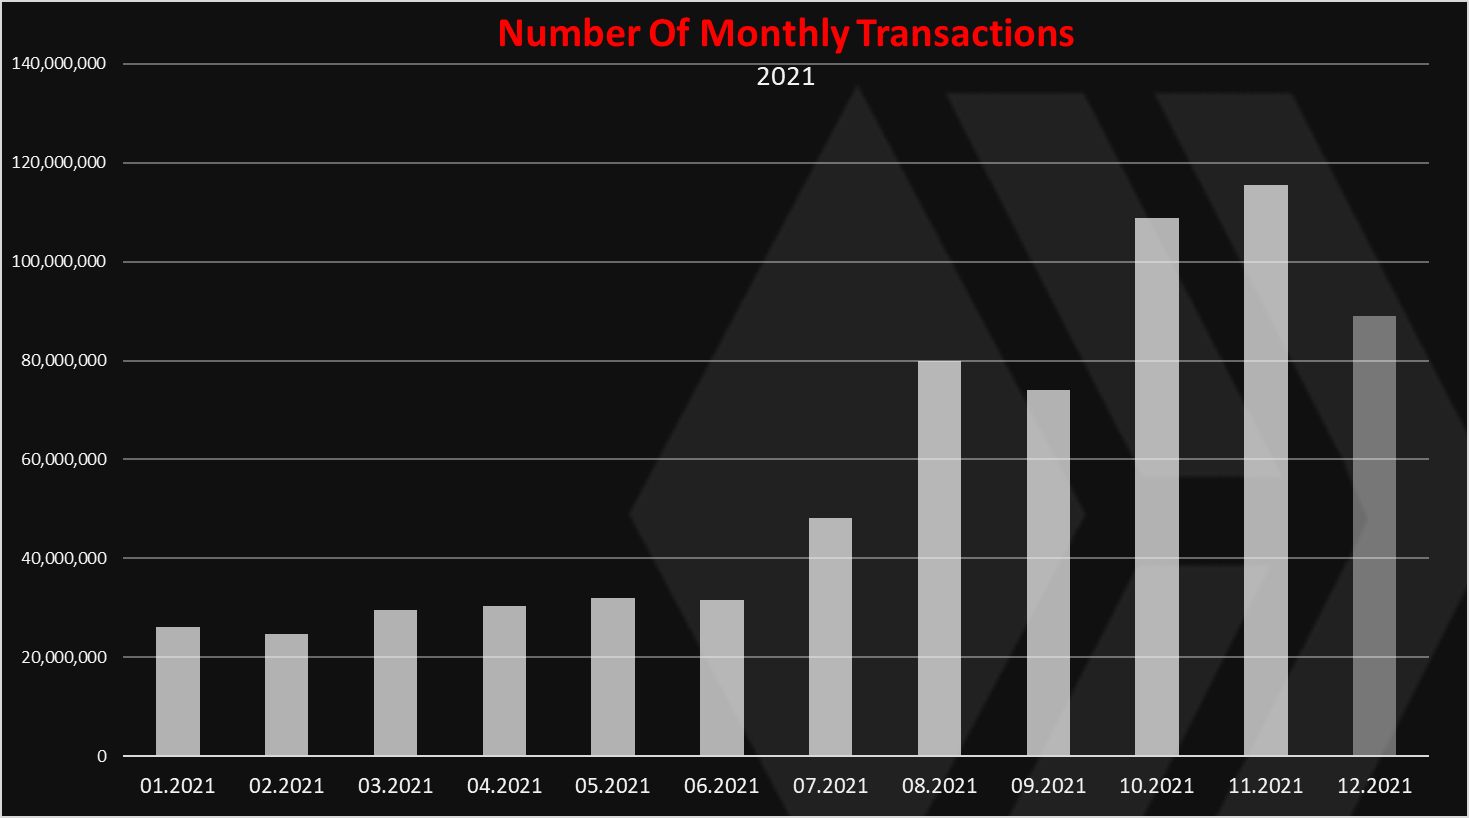
Up until June 2021, the number of transactions per month was around 30M. Then in July it started to grow, and it reached more then 100M transactions in October and November.
For comparison BTC has around 8M to 10M monthly transactions and ETH is around 30M to 40M. BSC is somewhere around 150M to 200M.
With the number of transactions as the above, Hive is proving that it is efficient and can handle the load.
All the best
@dalz
Posted Using LeoFinance Beta
https://twitter.com/Dalz19631657/status/1475827437581873157
The rewards earned on this comment will go directly to the person sharing the post on Twitter as long as they are registered with @poshtoken. Sign up at https://hiveposh.com.
As compared to btc and eth transaction seems Hive is bullying. Hope the trends keep going in new year to make it happening place in cryptosphere
Very similar to a post I just put out. Great minds think alike.
Posted Using LeoFinance Beta
Its an honor sir :)
This post has been manually curated by @bhattg from Indiaunited community. Join us on our Discord Server.
Do you know that you can earn a passive income by delegating your Leo power to @india-leo account? We share 100 % of the curation rewards with the delegators.
Please contribute to the community by upvoting this comment and posts made by @indiaunited.
Thanks for sharing this great post
I love these data type posts, I feel that over the years they will be a fond memory as we look back with a community of 100M users :)
Hive activity is staying strong and I think 2022 will bring more buzz to it. Splinterlands will only consolidate and bring more users, Leo Finance might exponentially trigger activities with Project Blank, Ragnarok for sure will boost this ecosystem and when Speak Network will move to Hive it will push it to the sky.
Posted Using LeoFinance Beta
We are just getting started..we will see more growth and improvement in the coming year(s). Thanks for the analysis.