Overview of the key Ethereum metrics | Supply, Activity, Hash Rate, Wallets, Transactions| January 2021
The bull market has been in full force in the recent month and the price of Ethereum also has grown reaching more than 1300$. There is a correction in the last 24h and Ethereum has dipped bellow 1k at this moment.
With all these price movements lets check the activity of the network and take look at the key Ethereum metrics.
The data presented here is mainly from etherscan charts and some Glassnode charts as well.
We will be looking at:
- Supply
- Block Rewards
- Number of Addresses
- Active Addresses
- Hash Rate
- Daily Transactions
- Fees
- Contracts
The period that we are looking into is from 2015 – 2020.
Supply
The supply is always an interesting topic in crypto. At the moment of writing this, January 11, 2021, Ethereum has a total supply of 114.2M coins.
Ethereum had a presale in 2014, where 60M ETH ware sold to investors and 12M ETH was allocated to a development fund. A total of 72M starting supply. Since then, more then 42M ETH were mined and added to the supply. Still the initial supply represents more than 60% of the current supply.
Here is the chart for the ETH supply over time.
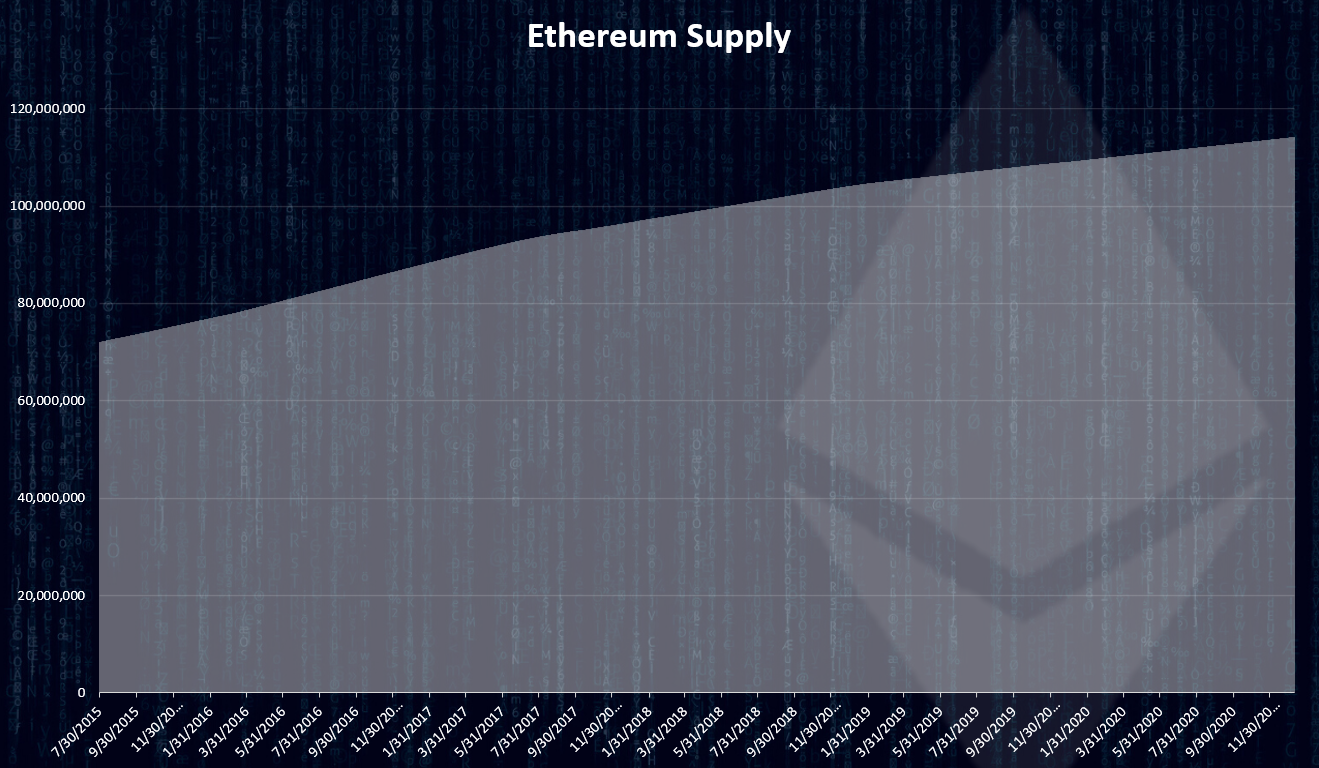
source
As mentioned more than 42M ETH in total were mined since its inception. We can see that the supply is slowly increasing. In the last year an approximate 5M ETH more was added to the supply. The year before that around 6M.
The block rewards chart looks like this.
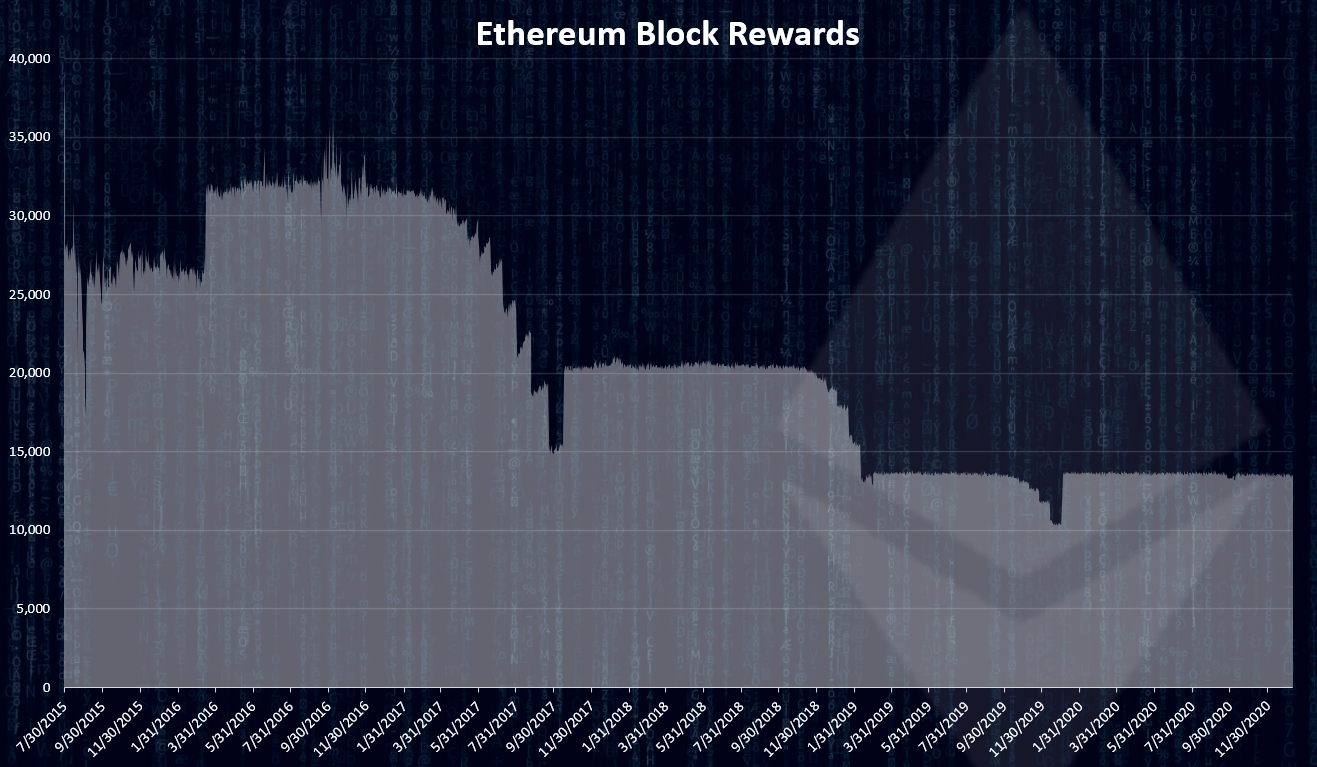
source
We can see that at first the block rewards (inflation) were higher with more than 30k ETH generated per day. It has dropped since then and at this moment around 13.5k ETH daily is added to the supply or around 405k ETH per month.
Number of addresses
Another key metrics for crypto projects is the number of wallets.
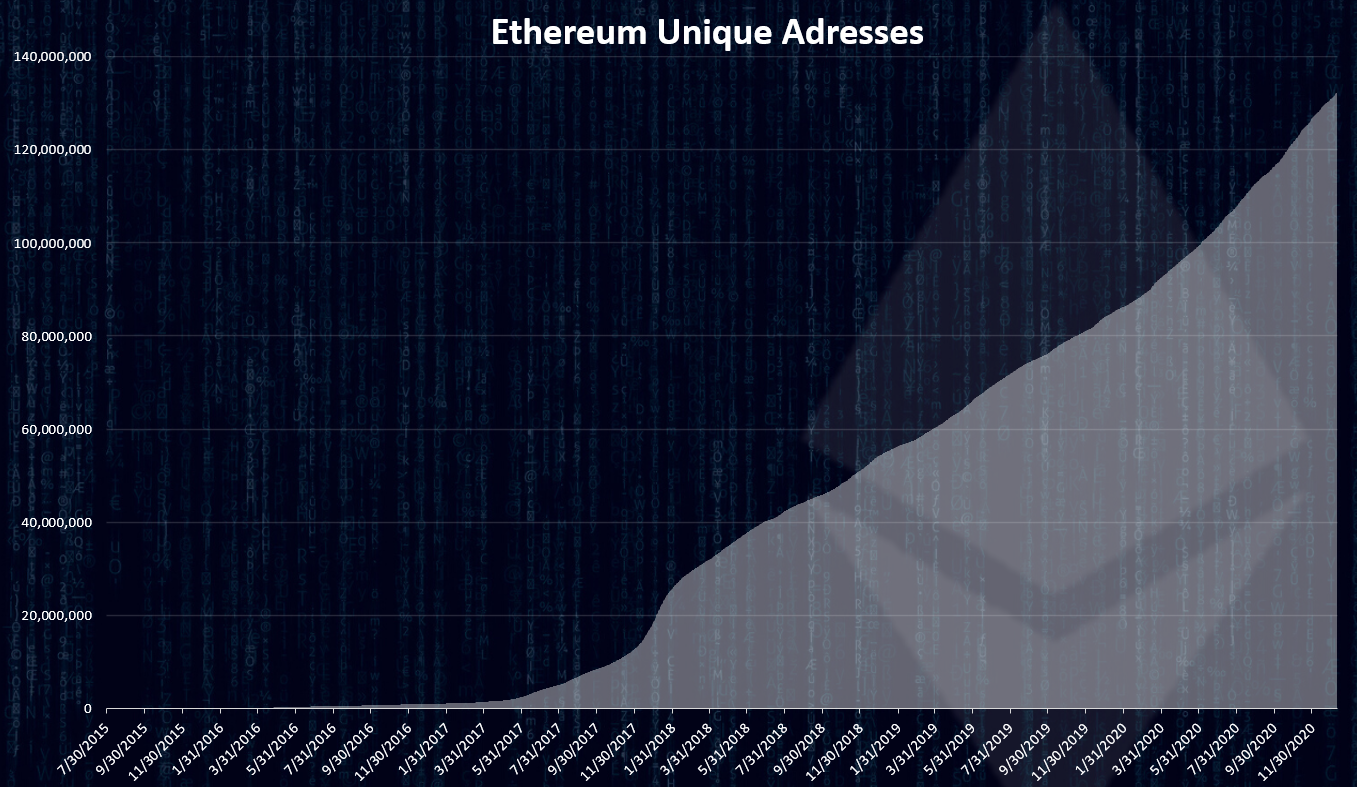
source
The number of ETH wallets addresses has been growing at a fast rate and now it more than 130M. It is the crypto with the highest number of wallets. For comparison Bitcoin has around 60M wallets at the moment.
Here is the chart for the number of new wallets created per year.
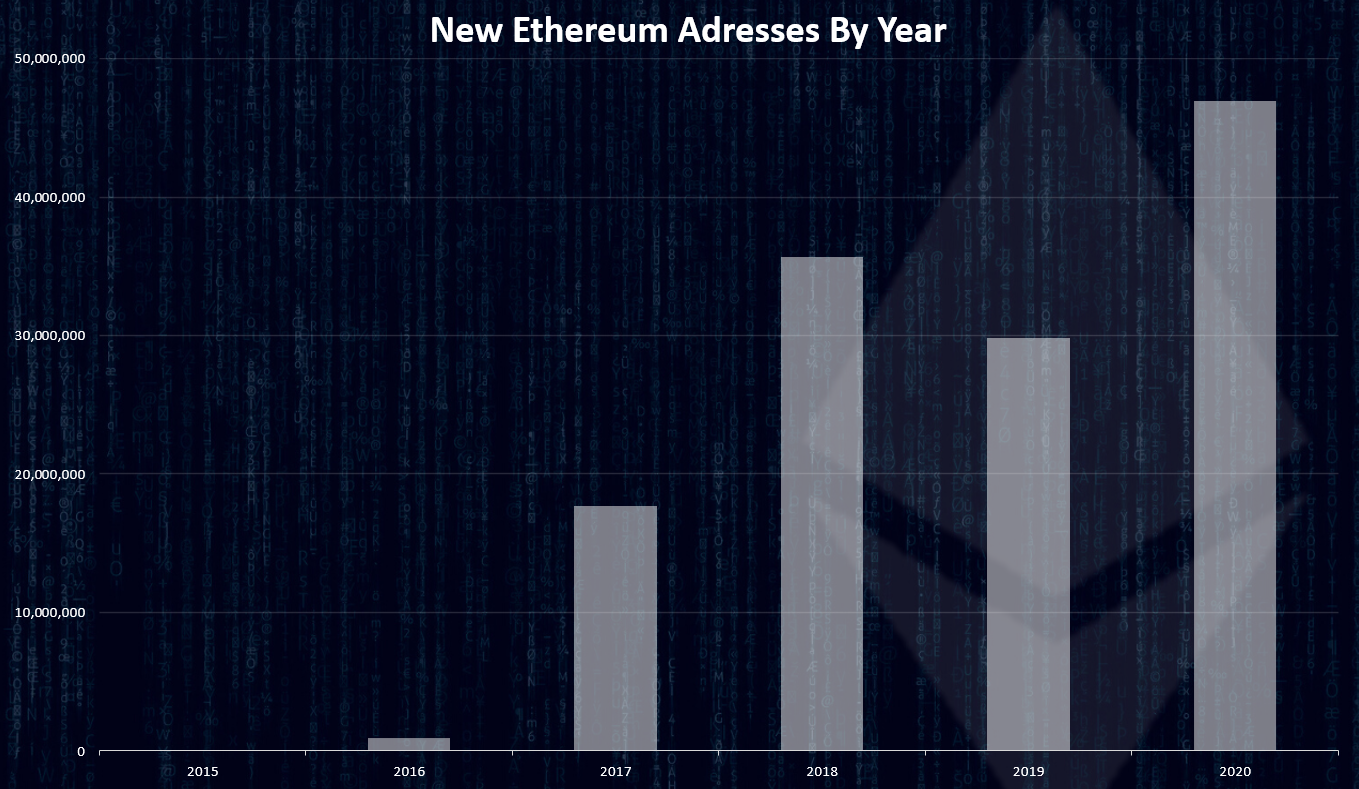
The first two years 2015 and 2016 had very low numbers of wallets and then in 2017 and 2018 we have seen a lot more wallets created. Almost 18M wallets in 2017 and 35M in 2018. A drop in 2019 and a record high number of wallets created in 2020 with almost 47M wallets.
Active addresses
How many of those 130M addresses are actually active?
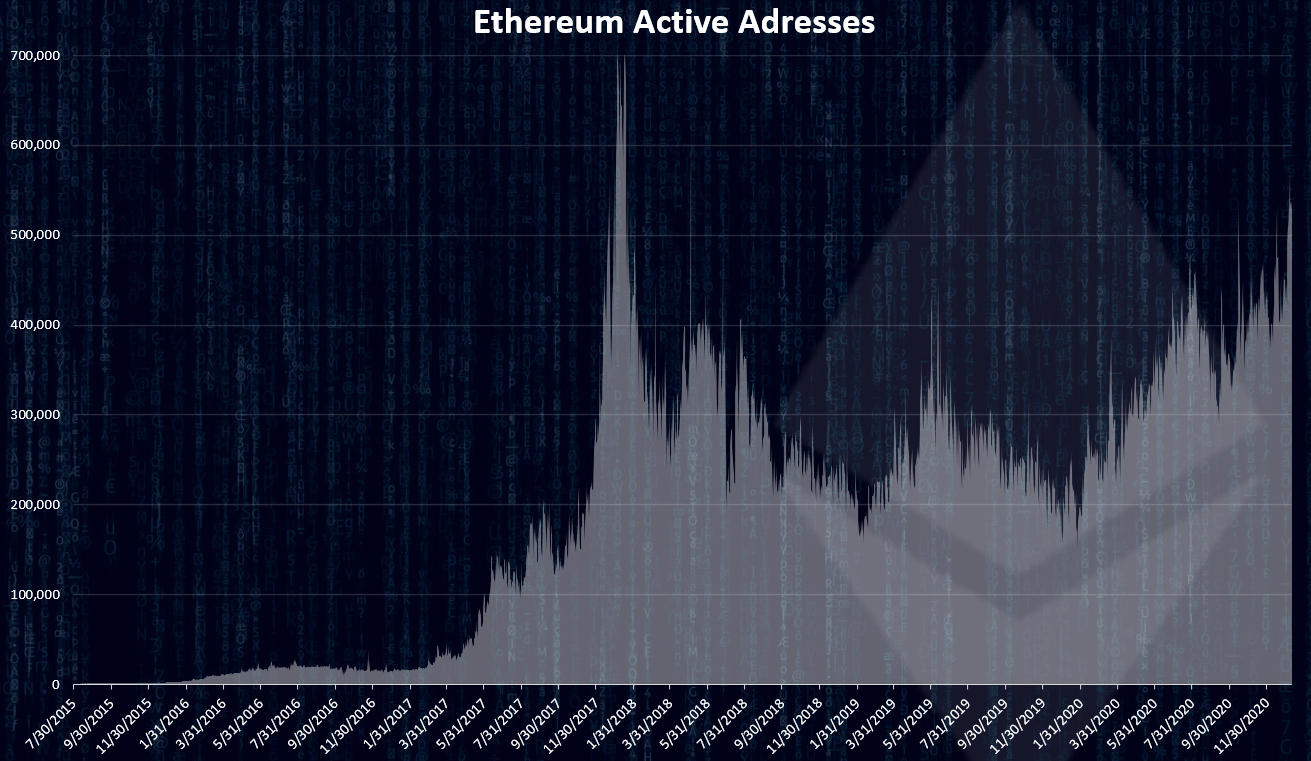
source
According to Glassnode the number of active addresses has just spiked reaching more than 500k active addresses per day. This is still lower from the ATH numbers in January 2018 when there was more than 700k active addresses per day.
Hash Rate
The network security in a proof of work chain is measured in hash rate, or how difficult is to mine. The bigger the completion, the higher the hash rate.
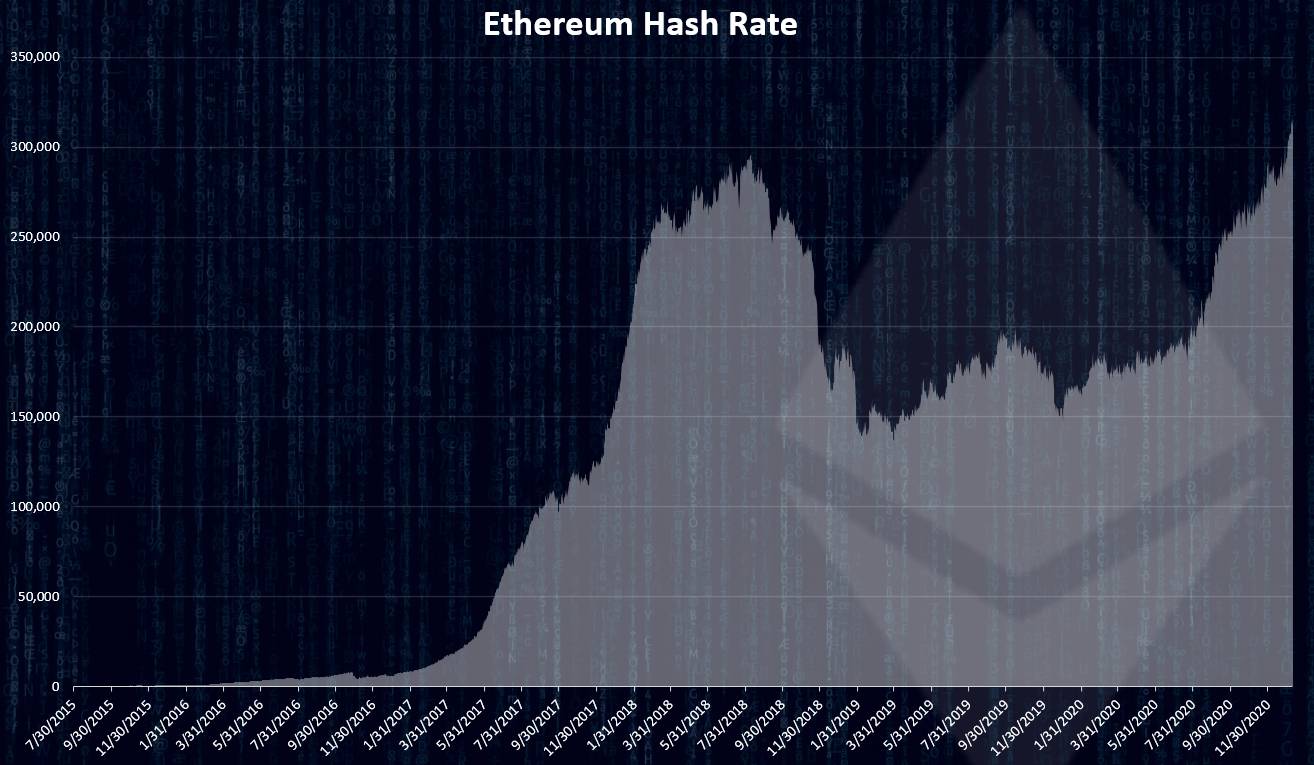
source
The ETH hash rate has been growing and it has reached a new ATH crossing the 300k GH/s. The Ethereum network now has more miners then ever before.
Daily Transactions
The activity on the network is mostly represented by the number of daily transactions.
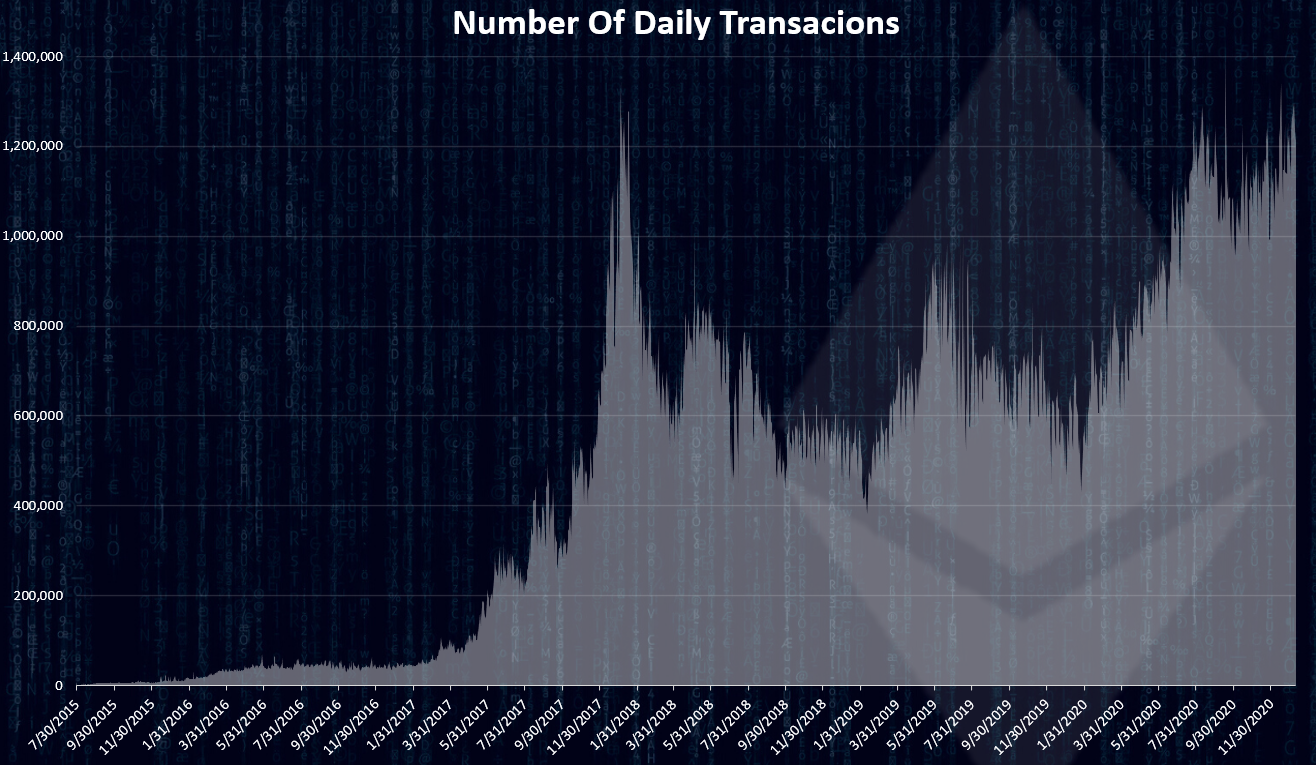
source
As we can see Ethereum has broken its ATH in number of transactions. On September 17, 2020 there was 1.4M transactions per day, breaking the previous record from January 4th, 2018 of 1.35M transactions per day. In the last days the numbers of transactions is around 1.2M.
#ETH Gas and fees
Next the daily fees in ETH.
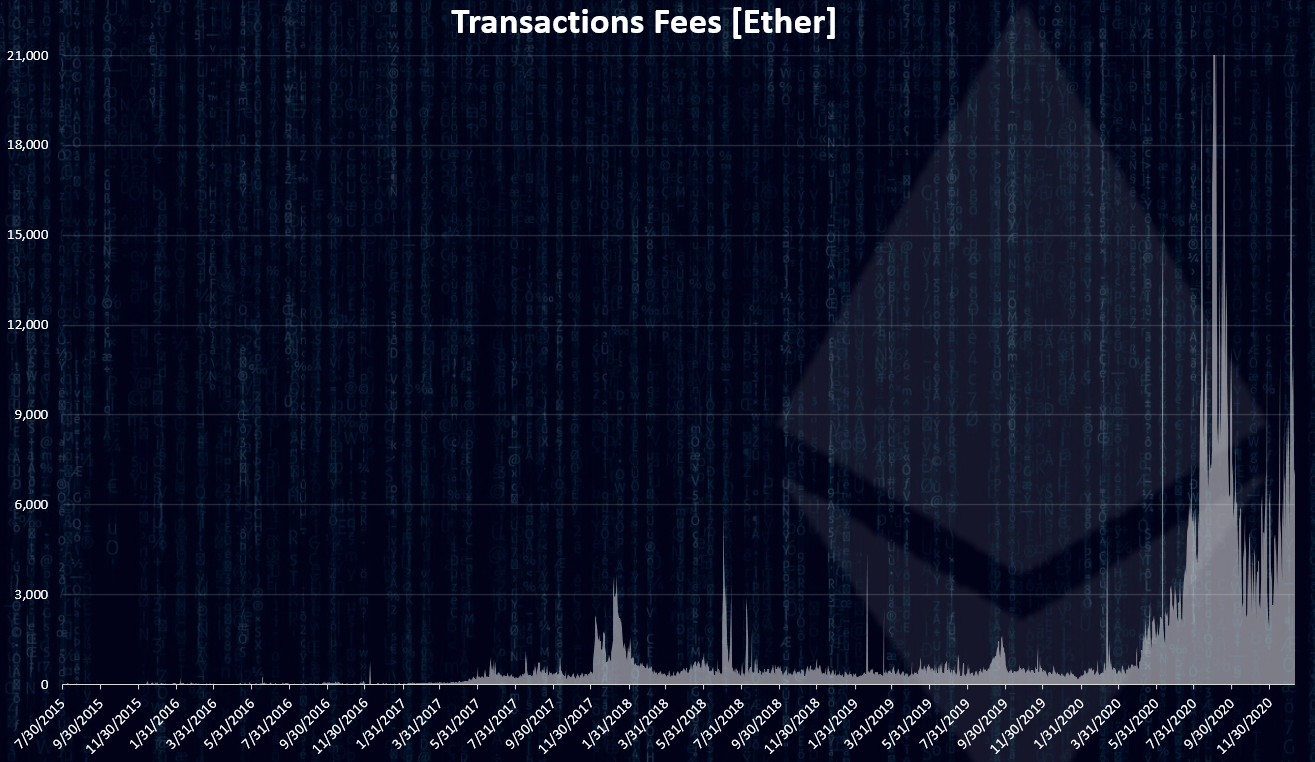
source
The fees are at all time high making the network not usable at times. On September 17 they have reached a massive 42.7k ETH per day. In today’s prices this is around 40M USD in fees daily. In the last period the fees are between 10k to 20k ETH per day or 10M to 20M USD.
The fees for a single transactions are measured in gWei, from the smallest ETH unit Wei. One ETH has one billion billion Wei (18 zeros). The gas price for transactions has been in the range from 100 gWei up to 600 gWei. In the bear market in 2019 the gas price was 10 to 20 gWei.
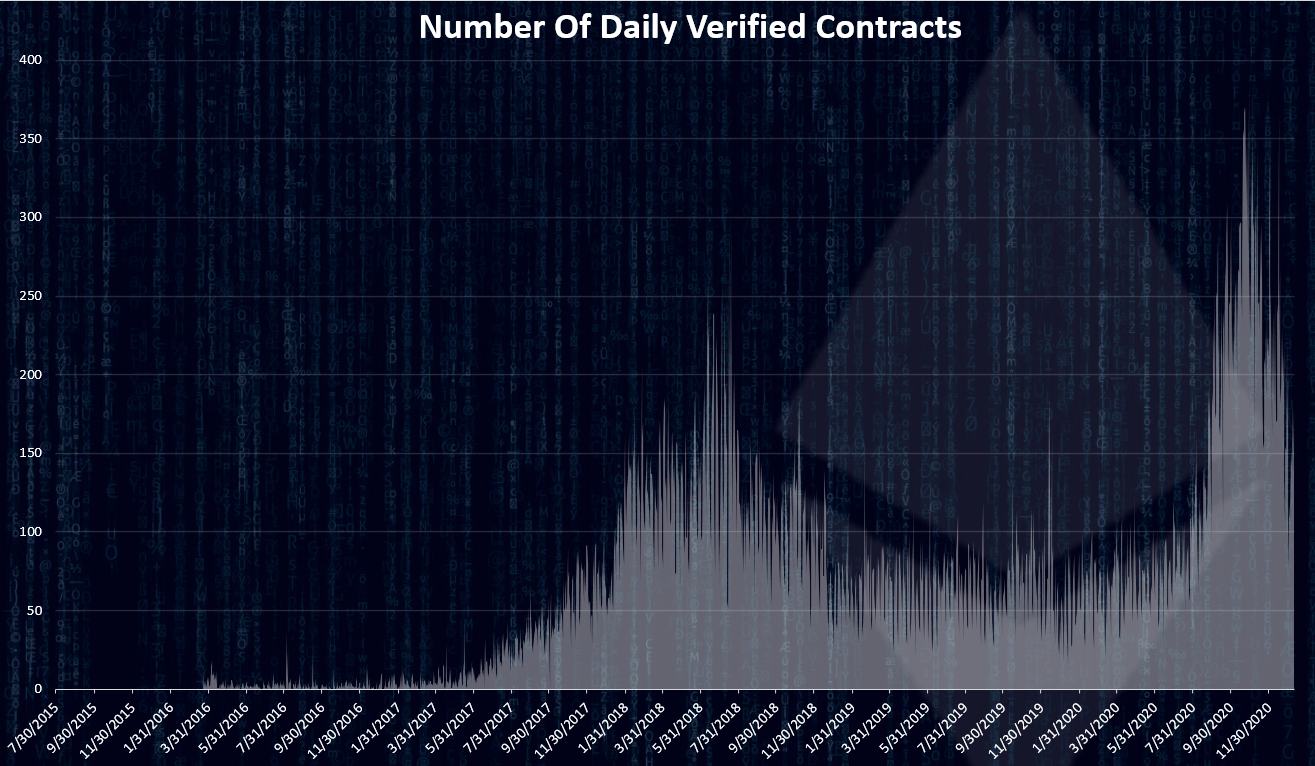
Verified Contracts
Ethereum is a smart contract blockchain. Here is the chart for verified contracts.
source
The number of verified contracts has grown almost exponentialy in the last months. Even higher growth than the 2017 bull run. This is all due to the DeFi movement.
The peak was at the end of October 2020, reaching almost 400 contracts per day, and a drop since then to around 200 daily contracts.
Overall, the Ethereum network metrics are following the price movement with more wallets created then ever in 2020, more active wallets as well reaching 500k daily active wallets. The Hash rate, the number of transactions and the contracts all have reached new all time highs but also the fees as well. With this level of activity and price movements Ethereum is on the verge of its capacity. Simple transactions fees are 10$ on regular basis and smart contracts transaction fees can go from 30$ to 50$, even a 100$ at moments. With these type of fees the network is becoming a whales platform where only transactions with significant amounts are made. The ETH 2.0 should solve some of the scalability issues but it is still years away. Anyways interesting time for the Ethereum blockchain 😊.
All the best
@dalz
Posted Using LeoFinance Beta
Beautiful stats like always!
Thanks for shading buddy!
Posted Using LeoFinance Beta
Thanks @resiliencia!
Posted Using LeoFinance Beta
https://twitter.com/Dalz19631657/status/1348753427388649473
That is very technical - I only have one question really - from this point how low do you think Etherium will go and will it then recover again?
Posted Using LeoFinance Beta
How low in terms of price?
Yes.
Their morality is not a major concern just yet, they are not Ripple at this point! Or are they?
I dont know .... although eth has established it self quite well
ETH market is on fire.
Posted Using LeoFinance Beta
I still cannot buy my Axies, bring down those fees Vitalik.
Posted Using LeoFinance Beta