Start of a rally?
How many of the BTC holders are currently in profit is measured using the “Supply Profitability State”, the median and 2 statistical bands:
🔵 % of offer that is in profit
🟢 +1 standard deviation from median (light blue line)
🔴 -1 standard deviation from median (light blue line)
The green areas are the times when >95% of BTC holders were in profit. You also see the same pattern in the last bull run.
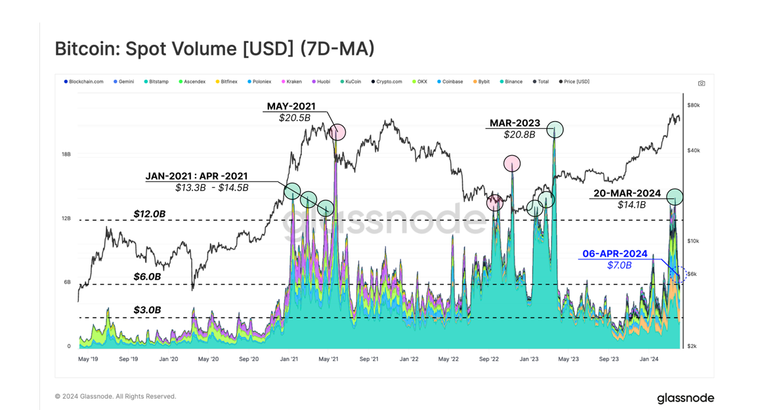
https://insights.glassnode.com
The on-chain data on short-term holders also suggests that we are currently not at a mid-top, but rather in the middle of a bull run.

If the parabolic phase starts now, that doesn't mean that we won't see any more corrections.
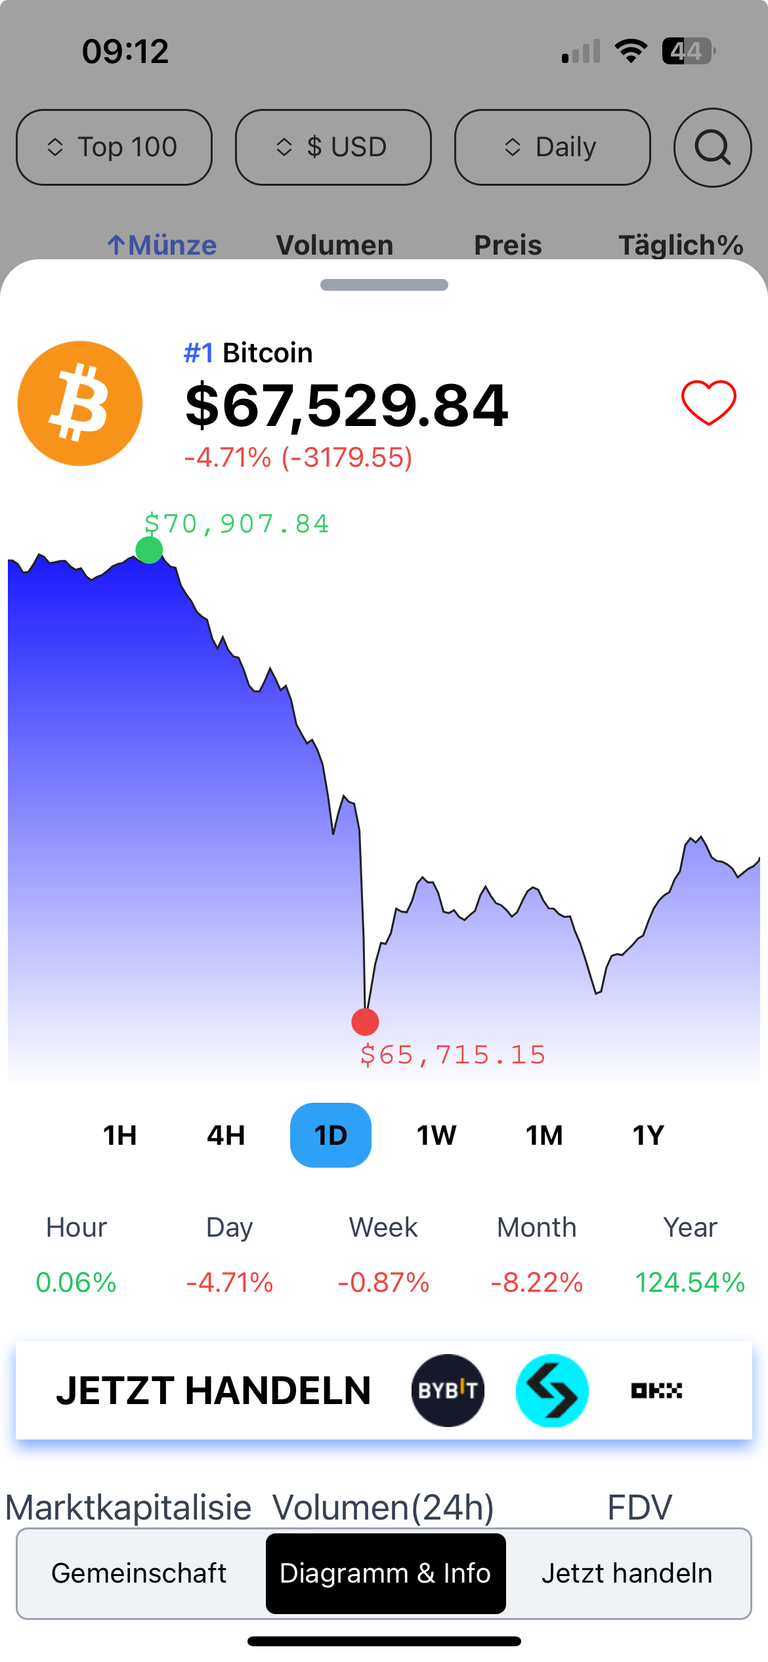
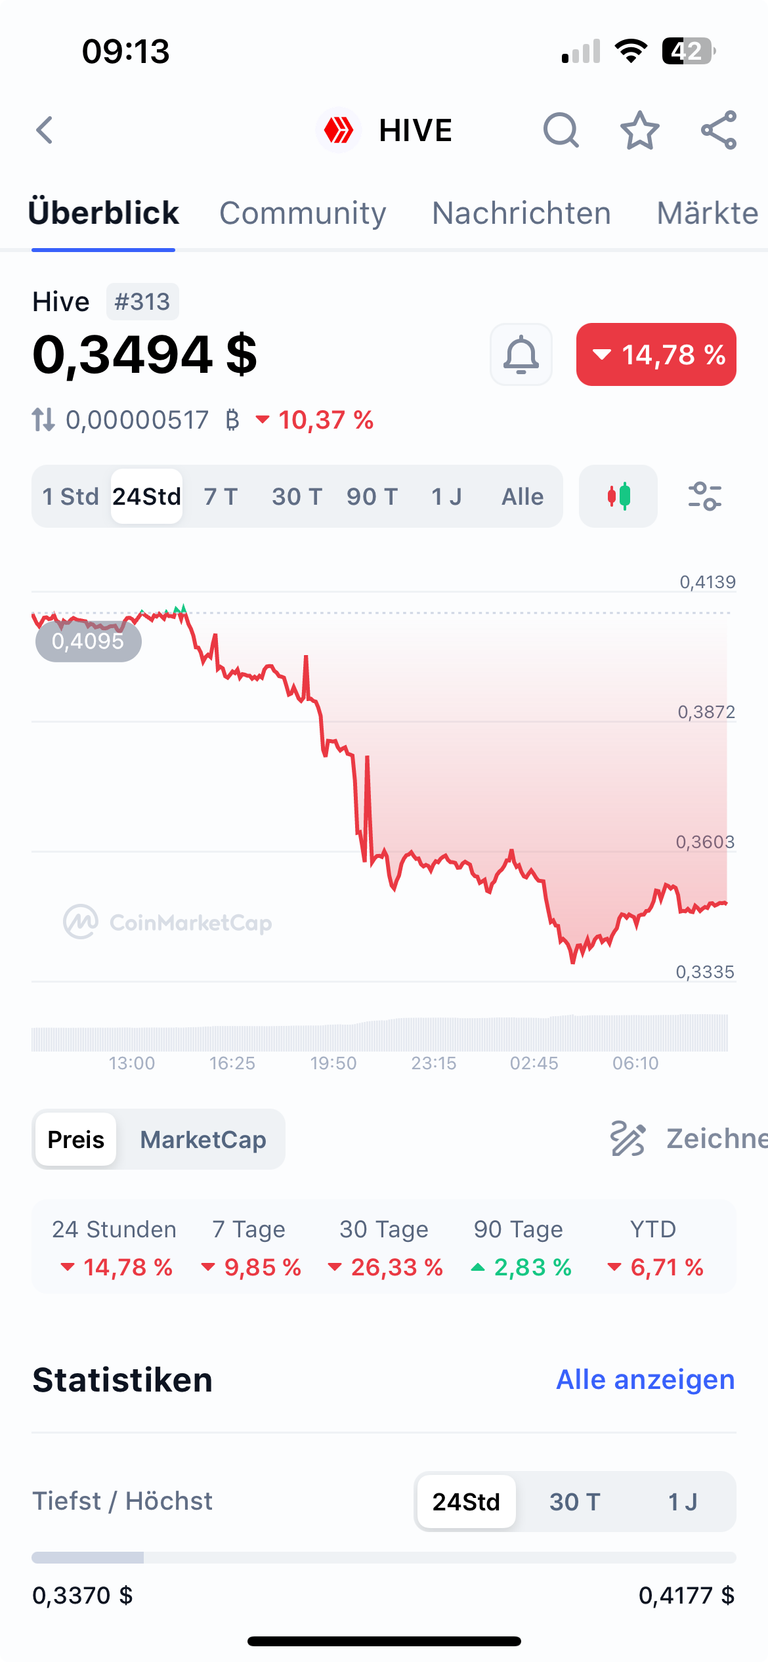
Here are the two charts. look good, right? Buy some more now. 😉 As always, everyone bears their own risk.

!BEER