Bitcoin 2023 analysis and projection |What can happen in the next few weeks? | EN-ES

Page used to create this cover
English
First of all a greeting to everyone in the Hive community, I hope you are all very well, before I start what is the main topic of this publication, I want to apologize for the absence of these months, I have been very busy really with personal family matters, but with, already several of them have been resolved and I want to get back in rhythm in what is this profile and bring information of value for all of you related to the financial markets, especially the {Cryptocurrencies, the Blockchain and external markets such as Synthetic Indexes} that I was explaining previously a few months ago already.
But leaving aside a bit of formalities and having sincerely apologized with you, I want to take the opportunity to talk about the Bitcoin; and what is happening with this asset which, in the last weeks since I started to observe it again, has had a quite interesting bullish momentum, so I will analyze it technically for you, give you my projections and what I would expect from the mother cryptocurrency, the great {Bitcoin}.
! [Version en Español]
[ES]
Primero que nada un saludo para todos en la comunidad de Hive, espero todos se encuentren muy bien, antes de iniciar lo que es el tema principal de esta publicación, quiero pedir disculpas por la ausencia de estos meses, he estado muy ocupado realmente con asuntos personales familiares, pero con, ya varios de ellos se han resuelto y quiero volver a tener ritmo en lo que es este perfil y traer información de valor para todos ustedes relacionado con los mercados financieros, en especial las {Criptomonedas, la Blockchain y los mercados externos como los Índices Sintéticos} que venía explicando anteriormente hace ya unos meses.
Pero dejando de lado un poco las formalidades y haber disculpado sinceramente con ustedes, quiero aprovechar la ocasión para hablar sobre el Bitcoin; y que es lo que está pasando con este activo el cual, en las ultimas semanas desde que comencé a observarlo de nuevo, ha tenido un impulso alcista bastante interesante, así que lo analizaré técnicamente para ustedes, les dare mis proyecciones y que es lo que esperaría de la criptomoneda madre, el gran {Bitcoin}

Bitcoin Analysis in 1-Week Charts
Particularly my way of analyzing the price is very simple, I do not complicate using indicators or anything that prevents me from making decisions with many confirmations, so I just rely on basic aspects to know the price action at that time, in addition to observing the general map and know what is the history of that asset, when I speak of history, I mean what it has done since its birth, if it has, for example, an uptrend or a downtrend.
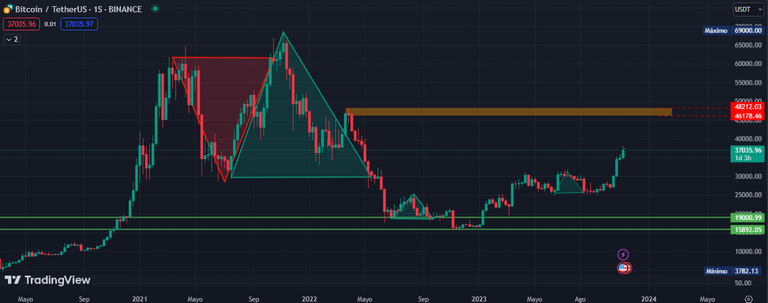
To be able to observe the complete map of what the asset has done I like to see 1H charts, this allows me to observe the complete picture and most importantly the trend, this is imperative that you know or always start your analysis from higher timeframes, towards the lower ones, Now, I use a lot the {Cycle Closes} in order to observe what could be the next direction of the price, these CC can be seen in the form of {Triangles}, cycle closes bearish red and bullish green,
If you observe well, we have a General Cycle Close (GCC), which helps me to know what the price could do, taking this into account, the low price once it closed that cycle, made everyone believe that it would follow a bearish path, deceiving investors; and subsequently forming what is called {Buying Leg}, which the price does with structure, making higher and higher lows and highs, breaking each of the zones upwards, confirming the power that buyers have, so, the medium term target, is the price reaches between 46. 178 and $48,212.
This is basically what we can do in this time frame, so it is not a time frame to trade, but to observe what the price is doing, so, knowing this, we can move to 1 day charts.
! [Version en Español]
[ES]
Particularmente mi forma de analizar el precio es muy sencilla, no me complico utilizando indicadores o algo que me impida tomar decisiones con muchas confirmaciones, así que solo me baso en aspectos básicos para saber la acción del precio en ese momento, además de observar el mapa general y saber cuál es el historial de dicho activo, cuando hablo de historial, me refiero a lo que ha hecho desde su nacimiento, si tiene por ejemplo, una tendencia alcista o una bajista.
Tradingview Chart
Para poder observar el mapa completo de lo que ha realizado el activo me gusta ver gráficos de 1S, esto me permite observar la foto completa y lo más importante la tendencia, esto es imperativo que lo sepan o que siempre comiencen su análisis desde temporalidades altas, hacia las más bajas, ya que hay mucho menos ruido y menor cantidad de velas, ahora bien, yo utilizo mucho los {Cierres de Ciclo} con la finalidad de observar cuál podría ser la siguiente dirección del precio, estos CC los pueden ver en forma de {Triángulos}, cierre de ciclo bajistas de color rojo y alcistas de color verde.
Si observan bien, tenemos un Cierre de Ciclo General (CCG), el cual, me ayuda a saber que es lo que podría hacer el precio, tomando esto en cuenta, el precio bajo una vez cerro ese ciclo, hizo creer a todos que seguiría un camino bajista, engañando a los inversores; y posteriormente formando lo que se llama {Pierna Compradora}, la cual el precio hace con estructura, haciendo mínimos y máximos cada vez más altos, rompiendo cada una de las zonas hacia alza, confirmando el poder que tienen los compradores, por lo que, el objetivo a mediano plazo, es el precio alcance entre los 46.178$ y los 48.212$.
Esto es básicamente lo que podemos realizar en este temporalidad, por lo que, no es un marco de tiempo para operar, sino para observar que es lo que está haciendo el precio, así que, ya sabiendo esto, sí podemos pasarnos a gráficos de 1 día.
Bitcoin Analysis in 1-Day Charts
In this time frame we can trade, although there are many ways to do it, however, what I like to do here is to mark zones, and these are those places on the chart where the price will surely have a reaction, in short, zones of supply, demand, support and resistance.
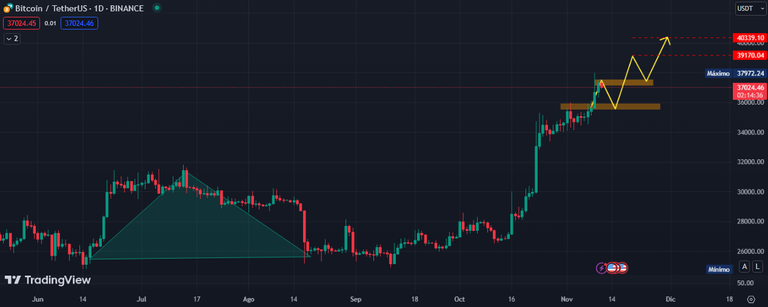
In this image things look a little clearer, the price gives us even more information than it gave us a week that, as I mentioned, is only to observe the full picture, the overall picture of the asset, but, once we know this, the next thing would be to look for internal Cycle Closings (CCI) in favor of what would be the overall cycle closing, if you look closely, you will see that a perfect CCI was formed, and the price consequently began to perform a bullish structure, so we already know the direction of the price.
On the other hand, the next thing is to apply the {Price Action} to mark {Recent} supports and resistances, which are the ones we are interested in right now and the ones that can make us win, the {Existing} supports and resistances are others, but, they have less effectiveness, however, they can also be traded, even so, the price is at a recent resistance, so the odds that it will go to the most recent support created to seek momentum and break the area between 37. 300 and the $37,500, once broken, the following would be to look for the next one would be to look for the $39,170 and later if it continues breaking zones, the $40,339.
! [Version en Español]
[ES]
En esta temporalidad si podremos operar, aunque hay muchas formas de hacerlo, sin embargo, lo que me gusta realizar acá es marcar zonas, y serán esos lugares en la grafica en donde el precio seguramente tendrá una reacción, en pocas palabras, zonas de oferta, demanda, soportes y resistencias.
Tradingview Chart
En esta imagen las cosas se ven un poco más clara, el precio nos da aún más información de la que nos dio una semana que, como mencione, solo es para observar la foto completa, el panorama general del activo, pero, una vez sabemos esto, lo siguiente sería buscar Cierres de Ciclo internos (CCI) a favor de lo que sería el cierre de ciclo general, si observan detenidamente, verán que se formó un CCI perfecto, y el precio en consecuencia comenzó a realizar una estructura alcista, así que ya sabemos la dirección del precio.
Por otro lado, lo siguiente es aplicar la {Acción del Precio} para marcar soportes y resistencias {Recientes}, que son las que nos interesan ahora mismo y las que nos pueden hacer ganar, los soportes y resistencias {Existentes} son otros, pero, tienen menor efectividad, sin embargo, también se pueden operar, aun así, el precio se encuentra en una resistencia reciente, por lo que las probabilidades que vaya al soporte más reciente creada para buscar impulso y romper la zona entre los 37.300$ y los 37.500$ , una vez roto, lo siguiente sería buscar la siguiente sería buscar los 39.170$ y posteriormente si sigue rompiendo zonas, los 40.339$.
Finally
This is a quick, but complete analysis of what {Bitcoin} could do in the next few weeks if it continues as it is going, the only way to think otherwise, is for the price to break the last upward momentum to the downside; and this momentum started at $33,700 or so, so far everything is positive, although, Halving is next year; and if you are followers of Bitcoin, we know that the real strong uptrend starts after this event happens, although, patterns were made to be broken, anything can happen. Follow me, I will keep updating these analysis, and if you want me to analyze another currency, just leave it in the comments.
! [Version en Español]
[ES]
Este es un análisis rápido, pero completo de lo que podría hacer {Bitcoin} en las próximas semanas si sigue como va, la única forma de pensar lo contrario, es que el precio rompa el último impulso alcista hacia la baja; y este impulso inicio en los 33.700$ aproximadamente, así que, hasta los momentos todo es positivo, aunque, el Halving es el año que viene; y si son seguidores del Bitcoin, sabemos que la verdadera tendencia alcista fuerte inicia después de que este evento pasa, aunque, los patrones se hicieron para romperse, todo puede pasar. Síganme, seguiré actualizando estos análisis, y si quieren que analice otra moneda, solo déjenlo en los comentarios.


Our Social Networks:
Instagram Erarium
Twitter Erarium
@tipu curate 8
Upvoted 👌 (Mana: 0/75) Liquid rewards.