How does the Deriv Trader Web application work for trading Synthetic Indices? | EN-ES
Page used to create this cover
English
A little more than 2 weeks ago I brought you a post about how to trade the "Boom and Crash", plus some essential recommendations to understand this market, apparently I have time to bring you this information every 2 weeks, but, will do my best to publish at least 2 posts a week, with the intention of not taking so long to update the trading guide of the "Synthetic Indices" and so you can go practicing in a "Demo" account, but, for this will take some time, since, I must publish about "Risk Management and trading plan", an information that will be basic, but where you will learn about these very important topics, since, something more deep and personalized, will have a cost very possibly, since I am dedicating myself to this.
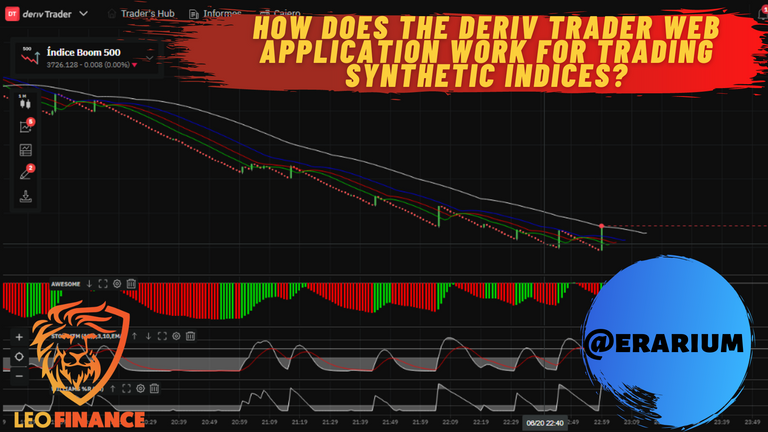
But, to change perspective and continue with the theme of this post, this time I will explain how to trade the "Crash and Boom" indices from the web application called "Deriv Trader" and all its features, since learning to manage the platform is essential before entering the strategies and how to trade these indices "Crash and Boom", so if you have not yet registered do not waste time, since the idea is that everyone is already registered and can access your account as quickly as possible, this will make things much easier for you and all the information about how to trade with the "Synthetic Indices". To follow the sequence, I will leave in this introduction the direct links to the publications I have published so far on this subject:
1. Introduction to "Synthetic Indexes".
2. Synthetic Indexes (Crash and Boom) Performance and Recommendations
¿What are Deriv Trader Multipliers and how do they work??

The multipliers in "Deriv" represent a way to operate very similar to what would be the famous "Leverage", this leverage would be a kind of loan or money that lends you the "Broker" in exchange for a guarantee on our part, this means that, depending on the capital we have in it, in short what we have deposited, we could access more or less money, so you can understand me better, if for example we have a capital of $ 1000 available, but to access an operation or also called position of $ 5000, we need to offer as collateral, about $ 500, in this way, the operation that we enter the platform will work as if we had invested about $ 5. 000 instead of $1.000 which is what we really have as capital.
Commonly the leverage is expressed in "Lots", which represent the volume that we will enter in an operation and that, depending on this lottage, we will place more or less money in guarantee to access the loan, but, in the web application "Deriv Trader", this has a much simpler concept and visualization, which is expressed in x100, x200, x300 and x400, this means that, for example, if we put 20$ of investment and choose x100 as leverage, we will earn 100% of our investment as long as the index increases 1%, the same happens with x200, it would be 200% and so on.
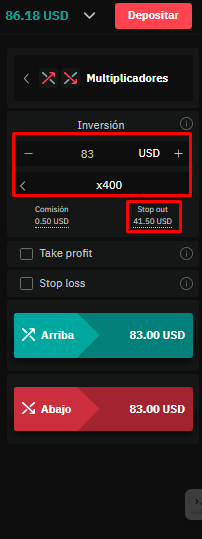
In the image above, you can see how the menu of the "Deriv Trader" platform looks visually to enter operations, the first thing we see is the way in which we choose to operate, which is "Multipliers", on the other hand, we have the investment part, it is here where we will place the amount of "Dollars or cryptocurrencies" that we are willing to invest, in addition to choosing the % of profit, on the other hand, if we choose to operate by this Web, each operation brings with it a commission, which will be of %0. 0015 of the investment multiplied by the chosen leverage and finally, the same platform provides you with an automatic "Stop Loss", which protects 50% of the investment you decide to place, that means that, whether you configure a "Stop Loss" or not, you will be protected, but, it can be beneficial and at the same time not so much.
Indicators and Tools
On the left side of the screen we can see the tools we have available to analyze the market, so, the next thing I will do is to explain in a clear and simple way each of them:
Chart Type
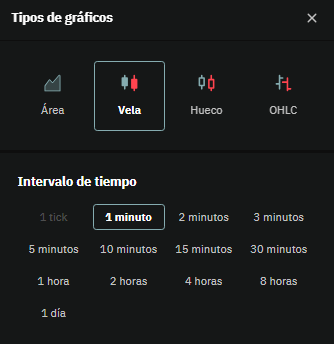
In this option we can choose the type of chart we want to observe at that time, so the first step is precisely that, the type of chart and for them we have 4 types which are; Area, Japanese Candlesticks, Hollow and OHLC, it is too much to tell you that, the most used type of chart is the Japanese candlesticks, so, this is the one we will use, regarding the time frame, it will depend on our way of analyzing and the type of trader we like to be, but, the most common to operate the "Crash and Boom" 1m, 5m, 15m and H1.
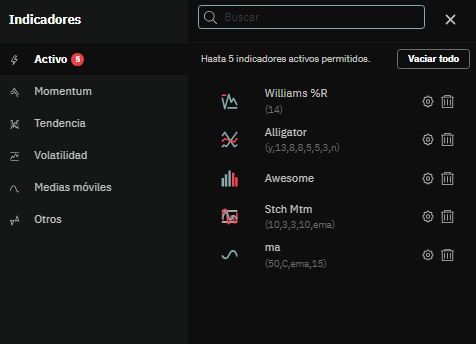
The following are the indicators, here we will have to choose the most used indicators by traders, although some of them are the basic ones, in my opinion we have more than enough to analyze and take advantage, yes, we have the opportunity to place on the chart up to a maximum of 5 indicators, which is fine, since the idea is not to saturate the chart with so many tools and clearly observe the price path.
Its use is really simple, this has nothing special, the only thing it does is to save the exact configuration that we had in the chart at a given time, which means that, if we use a series of indicators and every time we enter to perform our trading session we need them and we do not want to reposition them manually, this option allows us to save and place the same every time we want.

The drawing tools are essential for every analyst, in this option we will find trend lines, horizontal and vertical lines, rectangles, channels, among others, which are there especially to make our life easier and simpler when we see the chart, so the idea is that we get the most out of it.
Finally
I will leave this publication until here, I hope this information is very useful for you to start practicing once and for all in "Deriv", and know exactly how to enter a trade in the market and protect it, on the other hand, be prepared for a next publication where I will finally show some "Strategies" to trade the "Crash and Boom", besides sharing with you the experience of using "Deriv Trader", since, after this, I will start using the "Metatrader 5" platform, in which, we can also operate these indexes.

Español
Hace un poco mas de 2 semanas que les traje un post acerca de como operar los “Boom y Crash”, ademas de algunas recomendaciones esenciales para entender este mercado, aparentemente tengo tiempo de traerles esta información cada 2 semanas, pero, hará lo posible por publicar al menos 2 post a la semana, con la intención de no tardar tanto en actualizar la guía de operación de los “Índices Sintéticos” y así puedan ir practicando en una cuenta “Demo”, pero, para esto pasara un tiempo, ya que, debo publicar acerca de “Gestión de Riesgo y plan de trading”, una información que será básica, pero donde aprenderán sobre estos temas muy importantes, ya que, algo mas profundo y personalizado, tendrá un costo muy posiblemente, ya que me estoy dedicando a esto.
Pero, para cambiar de perspectiva y proseguir con el tema de este post, en esta ocasión les explicare la forma en como operar los índices “Crash y Boom” desde la aplicación web llamada “Deriv Trader” y todas sus características, puesto que, aprender a manejar la plataforma es primordial antes de adentrarnos a las estrategias y la forma de operar de estos índices “Crash Y Boom”, por lo que, si aun no se registran no pierdan tiempo, ya que la idea es que todos ya estén registrados y puedan acceder a su cuenta lo más rápido posible, esto les hará mucho más fácil las cosas y todo el compendio de información acerca de cómo hacer trading con los “Índices Sintéticos”. Para que sigan la secuencia, dejare en esta introducción los enlaces directos para las publicaciones que he publicado hasta ahora sobre este tema:
1. Introducción a los “Índices Sintéticos”
2. Índices Sintéticos (Crash Y Boom) Funcionamiento y Recomendaciones
¿Qué son los Multiplicadores en Deriv Trader y cómo funcionan?
Los multiplicadores en “Deriv” representan una forma de operar muy parecida a lo que sería el famoso “Apalancamiento”, este apalancamiento vendría siendo una especie de préstamo o dinero que te presta el “Broker” a cambio de una garantía por nuestra parte, esto quiere decir que, dependiendo del capital que tengamos en el mismo, en pocas palabras lo que hayamos depositado, podríamos acceder a mas o menos dinero, para que puedan entenderme mejor, si por ejemplo tenemos un capital de 1000$ disponibles, pero, para acceder a una operación o también llamada posicion de $5000, necesitamos ofrecer como garantía, unos $500, de esta forma, la operación que ingresemos en la plataforma trabajara como si hubiéramos invertido unos $5.000 en vez de $1.000 que es lo que realmente tenemos de capital.
Comúnmente el apalancamiento se expresa en “Lotes”, los cuales representan el volumen que ingresaremos en una operación y que, dependiendo de este lotaje, colocaremos mas o menos dinero en garantía para acceder al préstamo, pero, en la aplicación web “Deriv Trader”, este tiene un concepto y visualización mucho mas sencillo, el cual se expresa en x100, x200, x300 y x400, esto lo que significa es que, si por ejemplo, colocamos 20$ de inversión y elegimos x100 como apalancamiento, ganaremos el 100% de nuestra inversión siempre y cuando el índice aumente un 1%, lo mismo pasara con x200, seria el 200% y así sucesivamente.
En la imagen anterior, pueden ver como se ve visualmente el menú de la plataforma de “Deriv Trader” para ingresar operaciones, lo primero que vemos es la forma en la que elegimos operar, la cual, es “Multiplicadores”, por otro lado, tenemos la parte de inversión, es aquí donde colocaremos la cantidad de “Dolares o de criptomonedas” que estemos dispuestos a invertir, ademas de elegir el % de ganancia, por otro lado, si elegimos operar por esta Web, cada operación trae consigo una comisión, la cual será del %0.0015 de la inversión multiplicada por el apalancamiento elegido y por último, la misma plataforma ye brinda un “Stop Loss” automático, el cual protege el 50% de la inversión que decidas colocar, eso quiere decir que, configures o no un “Stop Loss”, estarás protegido, pero, puede ser beneficioso y a la vez no tanto.
Indicadores y Herramientas
En lado izquierdo de la pantalla podemos observar las herramientas que tenemos disponible para analizar el mercado, por lo que, lo siguiente que hare es explicar de forma clara y sencilla cada una de ellas:
Tipo de Grafico
En esta opción podemos elegir el tipo de grafico que deseemos observar en ese momento, por lo que, el primer paso es precisamente eso, el tipo de gráfico y para ellos tenemos 4 tipos que son; Área, Velas Japonesas, Hueco y OHLC, esta demas decirles que, el tipo de grafico mas utilizado es el de las velas japonesas, así que, es este el que usaremos, con respecto al marco de tiempo, dependera de nuestra forma de analizar y del tipo de trader que nos guste ser, pero, los más comunes para operar los “Crash y Boom” 1m, 5m, 15m y H1.
Lo siguiente son los indicadores, aquí tendremos para elegir los indicadores más utilizados por los traders, aunque algunos de ellos son los básicos, en mi opinión tenemos mas que suficiente para poder analizar y sacarle provecho, eso sí, tenemos la oportunidad de colocar en el grafico hasta un maximo de 5 indicadores, lo que esta muy bien, ya que la idea es no saturar el grafico con tantas herramientas y observar de forma clara el recorrido del precio.
Su uso es realmente sencillo, esto no tiene nada del otro mundo, lo unico que hace es guardar la configuración exacta que teníamos en el gráfico en un determinado momento, lo que quiere decir que, si utilizamos una serie de indicadores y cada vez que ingresemos para realizar nuestra sesión de operación los necesitamos y no queremos volver a colocarlos de forma manual, esta opción permite que se guarde y se coloque la misma cada vez que nosotros queramos.
Las herramientas de dibujo son esenciales para todo analista, en esta opción encontraremos líneas de tendencia, líneas horizontales y verticales, rectángulos, canales, entre otros, los cuales están allí especialmente para hacernos la vida más fácil y sencilla cuando nos toque ver el grafico, así que, la idea es que le saquemos el maximo provecho.
Por ultimo
Dejare esta publicación hasta aquí, espero que esta información les sea de mucha utilidad para que comiencen a practicar de una vez por todas en “Deriv”, y sepan exactamente como ingresar una operación en el mercado y protegerla, por otro lado, estén preparados para una próxima publicación en donde por fin mostrare algunas “Estrategias” para operar los “Crash y Boom, ademas de compartir con ustedes la experiencia de utilizar “Deriv Trader”, ya que, luego de esto, comenzare a utilizar la plataforma de “Metatrader 5”, en la cual, también podemos operar estos índices.


Yay! 🤗
Your content has been boosted with Ecency Points, by @erarium.
Use Ecency daily to boost your growth on platform!
Support Ecency
Vote for new Proposal
Delegate HP and earn more
@tipu curate 8
Upvoted 👌 (Mana: 0/71) Liquid rewards.