Synthetic Index Strategy for "Crash and Boom" in "Deriv trader" or Metatrader 5 | EN-ES

Page used to create this cover
English
Well, about 15 days ago I brought you the last publication about the assets called "Synthetic Indexes Crash and Boom", which I have been talking about for 2 months, this time, I bring you what most expect me to explain since I started this new series of publications and course about them, and is that, finally I will explain an effective strategy to trade in a simple way the "Crash and Boom", so, I hope you are ready because now we will begin with the good of what is trading with these assets to start making money.
However, I don't want you to get too excited either, since, the effectiveness in trading has nothing to do with the "Method or Strategy", but rather with the "Risk Management" that is applied, since, we can employ the best strategy, but, without a trading plan and money management I am completely sure that we will not succeed in this profession, so, we will not be successful in this profession, part of the way to success in one of the most difficult professions in the world, is to educate yourself and have your own process, I do not want to lie to you, here we lose operations, in opportunities we lose money, but, if we are aware of the management, we can even in a negative streak, be winners in this business, but, we go little by little, we will start with the method, or the strategies that we can apply, then we will go with the management and the plan.
Para comenzar con lo más interesante, comenzaremos con una “Estrategia” super sencilla, espero que la entiendan y les guste, por otro lado, si aún no has visto la serie de publicaciones acerca de los “Índices Sintéticos”, les dejare todos los posts que llevo hasta ahora, así que, antes de leer este, les recomiendo comenzar por el resto, para que comprendan de que estamos hablando:
1. Introduction to "Synthetic Indexes".
2. Synthetic Indexes (Crash and Boom) Performance and Recommendations
3. How Deriv Trader Web works to trade Synthetic Indices

Types of Strategy (Scalping and Intradia)
Before I begin to explain what is the "Strategy" that I will explain in this publication, I want to clarify that there are several types of operation or methods that we can apply depending on the type of trading we want to use, and I want to explain it, because, depending on the time that each person has, they will choose one of them as their own method, with the objective of analyzing and/or operating the "Crash and Boom" or any index or asset of their preference, there are no limits regarding this, so, let's go with the explanation, so that everyone is aware and placed with respect to the information:
Scalping trading
This is the method of operation that we will use and that I will explain in this publication, it is about analyzing the market mostly in very low time frames, especially in 1 minute, 3 minutes, 5 minutes to maximum 15 minutes, where, we will try to take operations for a very short time, which means that, the operations that we will open from the fulfillment of the conditions of our method or strategy, will last very little time open. Generally, in this type of trading, money management is easier to control, but I want you to keep in mind that we are exposing ourselves to much more risk, since we will be opening very possibly a good amount of operations per day, highlighting that this type of trading is especially for someone who has enough time to be at least 4 hours on a computer analyzing and watching every opportunity.
Intraday Trading
This type of trading is much less risky than the previous one, the reason why it is so, is very simple, first of all the analysis and the conditions of our method and / or strategy, take much longer to show, this means that our patience is the key to take successful operations, generally, the ratio "Risk-Benefit" of this type of trading is much more lucrative than the "Scalping", but, to obtain these profits can take much more time, since, to operate in "Intradia" or the so called position trading, we must analyze in temporalities of 1 hour, 4 hours and 1 day, so, the price will take much more time to develop, but, our analysis can be much more precise and less risky as I already commented.
Final appreciation: In this sense, it is up to each of you to decide to operate in one way or another, depending on the time and availability you have to devote to this business. In this opportunity, I will teach a strategy to operate type "Scalping", is the one that I like to use, since, I do not have much patience to wait for the conditions of my strategy to be fulfilled, but, they are very effective. Later on I will show a method to trade in high time frames.
Moving Average Strategy
The strategy that I will present in this opportunity is extremely simple, since we will only use a pair of "Moving Averages" which is an indicator that basically has a couple of good uses and that most traders around the world tend to use very often. In this sense, I will explain, first of all, what the "Moving Averages" are for:
Dynamic Supports and Resistances: The moving averages function perfectly as "Dynamic Support and Resistance, which means that, as the price moves, it seeks to lean on them to continue its course.
Trend Direction: The market is constantly moving in trends, these are "Bullish and Bearish", so, by placing a moving average, it is very easy to observe which is the trend of the asset.
Now, the "Moving Averages" that we will use in the strategy are the following:
- 200-period "Exponential" moving average
- Simple 10-period moving average
Strategy Explanation
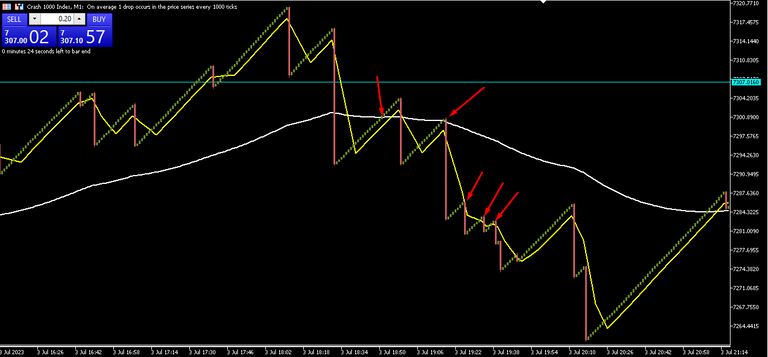
In the following image you can see how the "Moving Averages" mentioned above are already added, where, the "White" moving average is the one of 200 periods and the "Yellow" one is the one of 10, then we must color the graph in 1 minute and wait for the following conditions to be fulfilled:
In the "Crash 1000 and Crash 500, we must wait for the price to be below the "Averages", and then look for "Sell" trades in favor of the "Drops", in short the longest candlesticks.
In the "Boom 1000 and Boom 500, we must wait for the opposite, this time we will wait for the price to have surpassed the averages towards the rise, to begin to look for operations in favor of the "Spike", in short, to look for "Buys".
Subsequently, once the price looks for the averages of 200 and 10 and is about to touch them, as soon as it touches them, we must enter an operation in "Buy" for the case of the Boom and in "Sell" for the case of the Crash.
In the case of the image I shared above, we are in the "Crash 1000", we see how a large bearish candlestick called "Drop" broke the moving averages and we waited for the price, in this case the "Green" candlesticks Trends seek to touch these averages, to enter a trade in "Sell", if you look closely, in a matter of minutes we won about 5 operations, which are more than enough to leave with profits in our trading day.
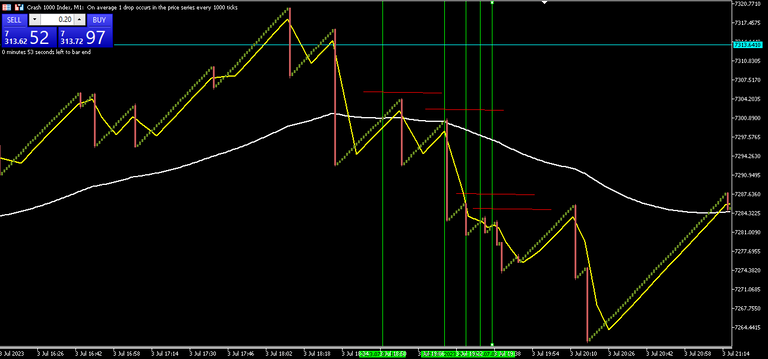
In the following image you can see it more clearly, the green "Vertical" lines indicate just the candle where we enter the trade in "Sell" and the red "Horizontal" lines represent the "Stop Loss" level of each trade.
Examples in Boom 1000
Everything I have explained for the "Crash 1000" also applies to the "Boom 1000", so, I show you some images of trades that would have been successful applying the strategy:
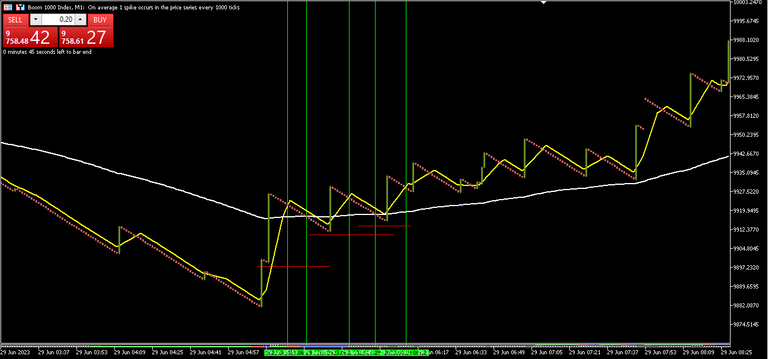
If you observe well, in the previous image we could have made about 5 entries after the price broke upwards the 200 period moving average, the "Stop Loss" is placed just below the last bullish candle and although the reactions are not given at the time, all came out in profits, since the "Spike" on all occasions exceeded the entry point.
Note: Something to keep in mind is that, for each "Spike" that we manage to catch, so to speak, we must take profits, and if sometimes the "Spike or Drop" is not greater than our entry point, we should only wait 2 candles and close that trade in loss and wait for the conditions to be met again.
Finally
I will leave this post until here and I really hope you have understood how simple is this trading strategy for the "Crash and Boom", so, practice it in "Demo" account over and over again, until you already have control of it. Wait for the next posts where I will talk about "Risk Management" so you can have a much simpler scheme and an idea of how you can start trading right away, although, my recommendation if you are starting, is to practice with fictitious money, before with real money and remember that you must invest money that you can afford to lose.

Español
Bueno, hace 15 días aproximadamente que les traje la última publicación acerca de los activos llamados “Índices Sintéticos Crash y Boom”, de los cuales les he venido hablando desde hace 2 meses, en esta oportunidad, les traigo lo que más esperan que explique desde que comencé con esta nueva serie de publicaciones y curso acerca de los mismos, y es que, por fin les explicare una estrategia efectiva para operar de forma sencilla los “Crash y los Boom”, así que, espero estén listos poque ahora vamos a comenzar con lo bueno de lo que es el trading con estos activos para comenzar a ganar dinero.
Sin embargo, no quiero tampoco que se emocionen demasiado, puesto que, la efectividad en el trading no tiene nada que ver con el “Método o Estrategia”, sino más bien con la “Gestión de Riesgo” que se aplique, ya que, podemos emplear la mejor estrategia, pero, sin un plan de trading y de gestión monetaria estoy completamente seguro de que no tendremos éxito en esta profesión, así que, parte del camino en éxito en una de las profesiones más difíciles del mundo, es instruirse y tener su propio proceso, no quiero mentirles, aquí se pierden operaciones, en oportunidades perdemos dinero, pero, si estamos conscientes de la gestión, podemos incluso en una racha negativa, ser ganadores en este negocio, pero, vamos poco a poco, comenzaremos por el método, o las estrategias que podemos aplicar, luego iremos con la gestión y el plan.
Para comenzar con lo más interesante, comenzaremos con una “Estrategia” super sencilla, espero que la entiendan y les guste, por otro lado, si aún no has visto la serie de publicaciones acerca de los “Índices Sintéticos”, les dejare todos los posts que llevo hasta ahora, así que, antes de leer este, les recomiendo comenzar por el resto, para que comprendan de que estamos hablando:
1. Introducción a los "índices sintéticos"
2. Índices sintéticos (Crash y Boom) Resultados y recomendaciones
2. Como funciona la aplicación Deriv Trader Web para negociar Índices Sinteticos
Tipos de Estrategia (Scalping e Intradia)
Antes de comenzar a explicar lo que es la “Estrategia” que explicare en esta publicación, quiero aclarar que, hay varios tipos de operación o métodos que podemos aplicar según el tipo de trading que queramos usar, y quiero explicarlo, porque, dependiendo del tiempo que posea cada quien, elegirán uno de ellos como su método propiamente dicho, con el objetivo de analizar y/o operar los “Crash y los Boom” o cualquier índice o activo de sus preferencia, no hay límites con respecto a esto, así que, vamos con la explicación, para que todos estén al tanto y situados con respecto a la información:
El trading de “Scalping”
Este es el método de operación que usaremos y que explicare en esta publicación, se trata de analizar el mercado en su mayoría de veces en temporalidades muy bajas, especialmente en 1 minuto, 3 minutos, 5 minutos hasta maximo 15 minutos, donde, trataremos de tomar operaciones por un tiempo muy corto, lo que quiere decir que, las operaciones que abriremos a partir del cumplimiento de las condiciones de nuestro método o estrategia, duraran muy poco tiempo abiertas. Por lo general, en este tipo de trading, la gestión monetaria es más fácil de controlar, pero, quiero que tengan presente que estamos exponiéndonos a mucho más riesgo, ya que, estaremos abriendo muy posiblemente una buena cantidad de operaciones al día, resaltando que, este tipo de trading es especial para alguien que tiene el tiempo suficiente para estar al menos unas 4 horas en una computadora analizando y viendo cada oportunidad.
El Trading “Intradia”
Este tipo de trading es mucho menos riesgoso que el anterior, la razón del porque es así, es muy sencilla, primeramente los análisis y las condiciones de nuestro método y/o estrategia, tardan muchísimo más en mostrarse, esto quiere decir que, nuestra paciencia es la clave para poder tomar operaciones exitosas, generalmente, el ratio “Riesgo-Beneficio” de este tipo de trading es mucho más lucrativo que el de “Scalping”, pero, obtener estas ganancias puede tardar mucho más tiempo, ya que, para operar en “Intradia” o el llamado trading de posicion, debemos analizar en temporalidades de 1 hora, 4 horas y 1 día, por lo que, el precio tardara mucho más en desarrollarse, pero, nuestros análisis pueden ser mucho más precisos y menos riesgosos como ya lo comente.
Apreciación final: En este sentido, queda a decisión de cada uno de ustedes en operar de una u otra forma, dependiendo del tiempo y la disponibilidad que tengan para dedicarle a este negocio. En esta oportunidad, enseñare una estrategia para operar tipo “Scalping”, es la que más me gusta usar, ya que, no tengo mucha paciencia para esperar a que las condiciones de mi estrategia se cumplan, pero, son muy efectivas. Mas adelante enseñare un método para operar en altas temporalidades.
Estrategia de Medias Móviles
La Estrategia que en esta oportunidad les presentare es sumamente sencilla, ya que solo usaremos un par de “Medias Móviles” el cual, es un indicador que tiene básicamente un par de usos bastante buenos y que la mayoría de los traders de todo el mundo suelen utilizar con mucha frecuencia. En este sentido, explicare, primero que nada, para que sirven las “Medias Móviles”:
Soportes y Resistencias Dinámicos: Las medias móviles funcionan perfectamente como “Soporte y Resistencia dinámicos, lo que quiere decir que, mientras el precio se desplaza, busca en apoyarse en estas para seguir su curso.
Dirección de la Tendencia: El mercado se mueve constantemente en tendencias, estas son “Alcistas y Bajistas”, por lo que, colocando una media móvil, es muy sencillo observar cual es la tendencia del activo.
Ahora bien, las “Medias Móviles” que utilizaremos en la estrategia son las siguientes:
- Media móvil “Exponencial” de 200 periodos
- Media móvil “Simple” de 10 Periodos
Explicación de Estrategia
En la siguiente imagen pueden observar como que ya están agregadas las “Medias Móviles” antes mencionadas, donde, la media móvil “Blanca”, es la de 200 periodos y la de color “Amarillo” es la de 10, posteriormente debemos color el grafico en 1 minuto y esperar que se cumplan las siguientes condiciones:
En el “Crash 1000 y Crash 500, se debe esperar a que el precio este por debajo de las “Medias”, para luego buscar operaciones en “Venta” a favor de los “Drops”, en pocas palabras de las velas más largas.
En el “Boom 1000 y Boom 500, se debe esperar lo contrario, en esta ocasión esperaremos que el precio haya sobrepasado las medias hacia el alza, para comenzar a buscar operaciones a favor de los “Spike”, en pocas palabras buscar “Compras”.
Posteriormente, una vez el precio busque las medias de 200 y 10 y este por tocarlas, apenas las toque, debemos ingresar una operación en “Compra” para el caso de los Boom y en “Venta” para el caso de los Crash.
En el caso de la imagen que compartí anteriormente, estamos en el “Crash 1000”, observamos como una gran vela bajista llamada “Drop” rompió las medias móviles y esperamos a que el precio, en este caso las velas Trends de color “Verde” buscaran tocar dichas medias, para ingresa una operación en “Venta”, si se fijan bien, en cuestión de minutos ganamos unas 5 operaciones, las cuales, son más que suficiente para salir con ganancias en nuestro día de operativa.
En la siguiente imagen pueden verlo más claro, las líneas “Verticales” verdes, señalan justo la vela en donde entramos en la operación en “Venta” y las líneas rojas “Horizontales”, representan el nivel de “Stop Loss” de cada operación.
Ejemplos en Boom 1000
Todo lo que he explicado para el “Crash 1000” también se aplica en el “Boom 1000”, así que, les muestro algunas imágenes de operaciones que hubieran salido exitosas aplicando la estrategia:
Si observan bien, en la imagen anterior se pudieron haber realizado unas 5 entradas luego de que el precio rompiera hacia arriba la media móvil de 200 periodos, el “Stop Loss” se coloca justo debajo de la última vela alcista que realizo y a pesar de que las reacciones no se dan al momento, todas salieron en ganancias, ya que el “Spike” en todas las ocasiones sobrepasaron el punto de entrada.
Nota: Algo a tener en cuenta es que, por cada “Spike” que logremos cazar, por decirlo de alguna manera, debemos tomar ganancias, y si en ocasiones el “Spike o Drop” no es mayor a nuestro punto de entrada, solo debemos esperar 2 velas y cerrar esa operación en perdida y esperar a que las condiciones nuevamente se cumplan.
Por ultimo
Dejare esta publicación hasta aquí y espero realmente que hayan entendido lo sencilla que es esta estrategia de operaciones para el “Crash y el Boom”, así que, practiquen en cuenta “Demo” una y otra vez, hasta que ya tengan control de ella. Esperen las próximas publicaciones en donde hablare de “Gestión de Riesgo” para que puedan tener un esquema mucho más sencillo y una idea de cómo pueden comenzar a operar desde ya, aunque, mi recomendación si estas comenzando, es que, practiques con dinero ficticio, antes de con dinero real y recuerda que debes invertir dinero que puedas permitirte perder.


@tipu curate 8
Upvoted 👌 (Mana: 0/75) Liquid rewards.