Synthetic Indices (Crash and Boom): How to operate, recommendations and performance | EN-ES

Page used to create this cover
English
Greetings to all the community, I hope everyone is very well, I apologize for all the days of inactivity I had during these weeks, but, I'm back to continue with the series of publications about the "Synthetic Indices", so, I hope you are prepared to continue learning and more now that comes the good thing in this, since, I will explain in detail how the assets that I like to operate are; The famous (Crash and Boom), quite particular indexes, which can bring very good profits with a fairly controlled and minimal risk management, but if we do not follow the rules to the letter, we can incur very large losses.
However, in this publication I will explain how to operate, what are the "Spike and Drops", how the price works and its displacement and show a simple strategy so that, from now on you can practice it in demo account, so, another good news is that I will leave the link of the "Broker" so that you can register. This publication will be an opener for everything that can be achieved by trading the "Crash and Boom", so expect many more strategies and ways to operate fully accessible to all who follow me in my "Hive Profile", in addition to my social networks in "Instagram and Twitter".
If you want to learn more about "Synthetic Indexes" and get up to date, here is my latest introductory post on them:
What are Crash and Boom?

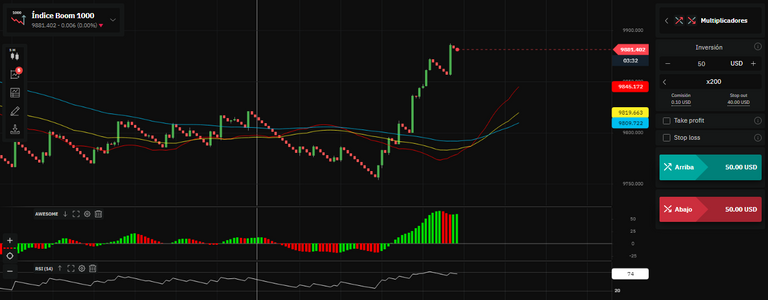
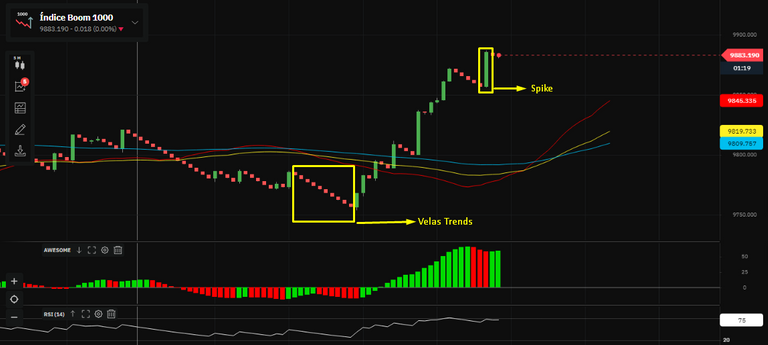
The synthetic indexes "Crash and Boom" are assets created by the "Broker" called "Deriv", which simulate the movement of the real market, however, has the particularity that the lower is the temporality in which we are analyzing or viewing the graph, the market looks strange and not like what we are used to, at least not at the beginning, since, what we will really see, is specific Japanese candlestick formations, some with a very large and extensive body called Spike and Drops, and other very small candlesticks that follow one after another, which are called "Trend Candles" or trend candlesticks.
The definition "Crash and Boom" is given by these BIG candles that makes the price, for example, in the case of Booms, these candles mentioned above are called (Spike) and in Crashes, they are called (Drop), since, one goes strong upwards (Spike) and another very strong downwards (Drop), of course, not always the candles are really prominent in one direction, because, depending on the structure and trend that it has, they will be more or less large, so, these indexes, although they are fictitious assets, are analyzable as any other stock market asset, which means that trend lines, trend channels, supports and resistances and this type of technical analysis tools work.
How does the pricing (Spikes and Drops) work?
Basically the price works like any other asset, the difference lies in that, for example in the temporalities of 1, up to 5 minutes, the candles look somewhat strange, as if it were not a normal market, however, the market becomes normal like any other, if we place temporalities of 30 minutes upwards, in that scenario, the candles look exactly the same as any other market, but, what is common or what risk investors like, is to operate at low time frames and hunt the so called "Spike and Drops", since, only operating these or hunting them as I said, can leave a good profit depending on the amount of money we invest in the operation.

Now, something to keep in mind is that, in this market as in any other, there is the "Stop Loss and Take Profit", however, specifically these assets (Crash and Boom), do not respect the "Stop Loss" that is placed, since the Spike and Drops happen so fast that the price does not respect them and you can incur in losses greater than those established in the "Stop Loss", the price does not respect them and you can incur losses greater than those established in the "Stop Loss", but this only occurs if we operate against the Spike and Drops, in short, if we focus on operating the famous "Candlesticks Trends" that I mentioned.
Now, if we focus on operating the Spike and Drops, the Stop Losses work perfectly and as the Trends candlesticks work in only one direction (In the Boom down and in the Crash up), it respects them perfectly and we can have a fairly controlled risk management, this is where the magic really happens and the good to operate these indices, since, having the risk more than controlled, we can devise pretty good strategies that allow us to obtain the desired percentage of the day in just one Spike or Drop candle that we manage to hunt.
There are many strategies to apply to operate the (Crash and Boom), however, as a recommendation, do not want to learn all the strategies, it is a lot of information and in the end what it will do is confuse you, so, you will end up burning the account, so, the ideal is to apply a strategy or method where the trader feels as comfortable as possible and that on the way you go perfecting it to your liking without jumping from method to method, on the other hand, before starting to explain the (Strategies) that I will leave for another publication, I must make a separate post explaining the operation of the platforms on which you can operate these assets, such as the platform of "Deriv and the famous "Metatrader 5".
Finally
This has been a start post to learn about the Synthetic Indices (Crash and Boom), which, I hope you have liked and also served to understand how they work, I know you may want to go at once to the strategies, but first, I must teach you how the platforms work where we can operate, so, patience hehe, on the other hand, I will also explain "Binary" strategies with "Volatility" indices, which are much simpler and really do not have to know certainly trading, but, it can work to get a daily percentage of your capital.
Last but not least, I leave you the registration link of (Deriv Broker) where these indexes are hosted, it is the only Broker where you can find them, so get active and start practicing on a "Demo" account. Click on this Link to register.

Español
Saludos para toda la comunidad, espero todos estén muy bien, pido disculpas por todos los días de inactividad que tuve durante estas semanas, pero, ya he regresado para seguir con la serie de publicaciones acerca de los “Índices Sintéticos”, así que, espero que estén preparados para seguir aprendiendo y mas ahora que viene lo bueno en esto, ya que, explicare en detalle como funcionan los activos que mas me gustan operar que son; Los famosos (Crash y Boom), unos índices bastante particulares, los cuales, pueden traer muy buenas ganancias con una gestión de riesgo bastante controlada y mínima, pero que, si no seguimos al pie de la letra las normas, podemos incurrir en perdidas muy grandes.
Sin embargo, en esta publicación explicare como se operan, que son los “Spike y los Drops”, como funciona el precio y su desplazamiento y mostrar una estrategia sencilla para que, desde ya puedan practicarla en cuenta demo, por lo que, otra buena noticia es que les dejare el enlace del “Broker” para que se puedan registrar. Esta publicación será un abreboca para todo lo que se puede lograr operando los “Crash y los Boom”, así que, esperen muchas mas estrategias y formas de operar totalmente accesibles para todos los que me sigan en mi “Perfil de Hive”, ademas de mis redes sociales en “Instagram y Twitter”.
Si quieres conocer más sobre los “Índices Sintéticos” y ponerte al día, te dejo mi última publicación de introducción sobre los mismos:
¿Qué son los Crash y Boom?
Lo Índices sintéticos “Crash y Boom” son unos activos creados por el “Broker” llamado “Deriv”, los cuales simulan el movimiento del mercado real, sin embargo, tiene la particularidad de que, mientras mas baja es la temporalidad en la que estemos analizando o viendo la gráfica, el mercado se ve extraño y no igual a lo que estamos acostumbrados, al menos no al principio, ya que, lo que realmente veremos, es formaciones de velas japonesas específicas, algunas con un cuerpo muy grande y extenso llamados Spike y Drops, y otras velas muy pequeñas que siguen una tras de otra, las cuales tienen por nombre “Velas Trends” o velas de tendencia.
La definición “Crash y Boom” viene dada por estas velas GRANDES que hace el precio, por ejemplo, en el caso de los Boom, estas velas antes mencionadas se les llama (Spike) y en los Crash, se les llama (Drop), ya que, uno va fuerte hacia arriba (Spike) y otro muy fuerte hacia abajo (Drop), por supuesto, no siempre las velas son realmente prominentes en una dirección, ya que, dependiendo de la estructura y tendencia que este tenga, serán mas o menos grandes, por lo que, estos índices, a pesar de que son activos ficticios, son analizables como cualquier otro activo bursátil, lo que quiere decir que, funcionan las líneas de tendencia, los canales de tendencia, los soportes y resistencias y este tipo de herramientas de análisis técnico.
¿Como funciona el precio (Spikes y Drops)?
Básicamente el precio funciona como cualquier otro activo, la diferencia radica en que, por ejemplo en las temporalidades de 1, hasta 5 minutos, las velas se vean algo raras, como si no fuera un mercado normal, sin embargo, el mercado pasa a ser normal como cualquier otro, si colocamos temporalidades de 30 minutos hacia arriba, en ese panorama, las velas se ven exactamente iguales a las de cualquier otro mercado, pero, lo común o lo que les gusta a los inversores de riesgo, es operar a temporalidades bajas y cazar los llamados “Spike y Drops”, ya que, solo operando estos o cazándolos como comente, puede dejar una buena ganancia dependiendo de la cantidad de dinero que invirtamos en la operación.
Ahora bien, ago a tener en cuenta es que, en este mercado como en cualquier otro, existe el “Stop Loss y el Take Profit”, sin embargo, específicamente estos activos (Crash y Boom), no respetan el “Stop Loss” que se coloque, puesto que, los Spike y Drops suceden tan rápido que, el precio no los respeta y puedes incurrir en perdidas mayores a las establecidas en el “Stop Loss”, pero, esto solo ocurre si es que operamos en contra de los Spike y Drops, en pocas palabras, si nos enfocamos en operar las famosas “Velas Trends” que les comente.
Ahora bien, si nosotros nos enfocamos en operar los Spike y Drops, los Stop Loss funcionan perfectamente y como las velas Trends funcionan en una sola dirección (En los Boom hacia abajo y en los Crash hacia arriba), los respeta perfecto y podemos tener una gestión de riesgo bastante controlada, es aquí donde realmente ocurre la magia y los bueno al operar estos índices, ya que, al tener el riesgo mas que controlado, podemos idear estrategias bastante buenas que nos permita obtener el porcentaje deseado del día en tan solo una vela Spike o Drop que logremos cazar.
Hay muchísimas estrategias que aplicar para operar los (Crash y Boom), sin embargo, como recomendación, no quieras aprender todas las estrategias, es mucha información y al final lo que hará es confundirte, por lo que, terminaras quemando la cuenta, así que, lo ideal es aplicar una estrategia o método en donde el operador se sienta lo más cómodo posible y que en el camino la vaya perfeccionando a su gusto sin estar saltando de método en método, por otro lado, antes de comenzar a explicar las (Estrategias) que las dejare para otra publicación, debo realizar un post aparte explicando el funcionamiento de las plataformas en las que se pueden operar estos activos, como por ejemplo, la plataforma de “Deriv y el famoso “Metatrader 5”.
Por ultimo
Este ha sido un post de inicio para aprender sobre los Índices Sintéticos (Crash y Boom), el cual, espero que les haya gustado y servido ademas para entender como funcionan, se que pueden querer ir de una vez a las estrategias, pero antes, debo enseñarles como funcionan las plataformas en donde podemos operar, así que, paciencia jeje, por otro lado, también explicare estrategias de “Binarias” con los índices de “Volatilidad”, que son mucho mas sencillas y realmente no hay que conocer ciertamente de trading, pero, les puede funcionar para obtener un porcentaje diario de su capital.
Por último, pero no menos importante, les dejo el enlace de registro del (Broker Deriv) donde se alojan estos índices, es el unico Broker donde podrán encontrarlos, así que actívense y comiencen a practicar en una cuenta “Demo”. Hagan click en este Enlace para registrarse.


@tipu curate 8
Upvoted 👌 (Mana: 0/69) Liquid rewards.
Congratulations @erarium! You have completed the following achievement on the Hive blockchain And have been rewarded with New badge(s)
Your next payout target is 2000 HP.
The unit is Hive Power equivalent because post and comment rewards can be split into HP and HBD
You can view your badges on your board and compare yourself to others in the Ranking
If you no longer want to receive notifications, reply to this comment with the word
STOP