[Learn photography] Histogram in photography? - Histogramm bei der Fotografie?
Hallo zusammen,
Vorwort - Foreword
Histogramme sind ein großartiges Werkzeug in der Fotografie, die du verwenden solltest, sobald du die Grundlagen und die Beziehung zwischen Blende, ISO und Verschlusszeit kennst (Belichtungsdreieck). Histogramm und Lichtbalance sind großartige Werkzeuge, um die Helligkeit bei der Kamera vor dem und nach dem aufgenommenen Bildern zu überprüfen. Ich nutze diese selber, um die richtige Belichtung einzustellen, bevor ich das Foto aufnehme. Ich zeige dir das ganz einfach und anhand konkreter Beispiele, wie Sie das Diagramm interpretieren und wie du es verwendest.
Histograms are a great tool in photography that you should use once you know the basics and the relationship between aperture, ISO and shutter speed (exposure triangle). Histogram and light balance are great tools to check the brightness on camera before and after the picture is taken. I use these myself to set the correct exposure before I take the photo. I'll show you how to interpret the chart and how to use it very simply and with concrete examples.
Was ist ein Histogramm bei der Fotografie? - What is a histogram in photography?
Ein Histogramm ermöglicht die Beurteilung der Tonwerte, wie z. B. die Helligkeit oder Kontrast auf dem Bild oder auf dem Display von der Kamera. Nachträglich kann das Histogramm mit einer Grafiksoftware wie Photoshop oder Lightroom interpretiert und die Helligkeitswerte angepasst werden. So kann man beispielsweise ein Bild aufhellen oder abdunkeln, indem man die Helligkeitswerte im Histogramm anpasst. Aber wenn es schon vor der Aufnahme richtig eingestellt ist, spart man sich viel Arbeit bei der Nachbearbeitung.
A histogram allows you to evaluate the tonal values, such as brightness or contrast, on the image or on the display from the camera. Afterwards, the histogram can be interpreted and the brightness values adjusted using graphics software such as Photoshop or Lightroom. For example, you can lighten or darken an image by adjusting the brightness values in the histogram. But if it's set correctly before you take the picture, you save a lot of work in post-processing.
Wie lese ich ein Histogramm richtig - How to read a histogram correctly
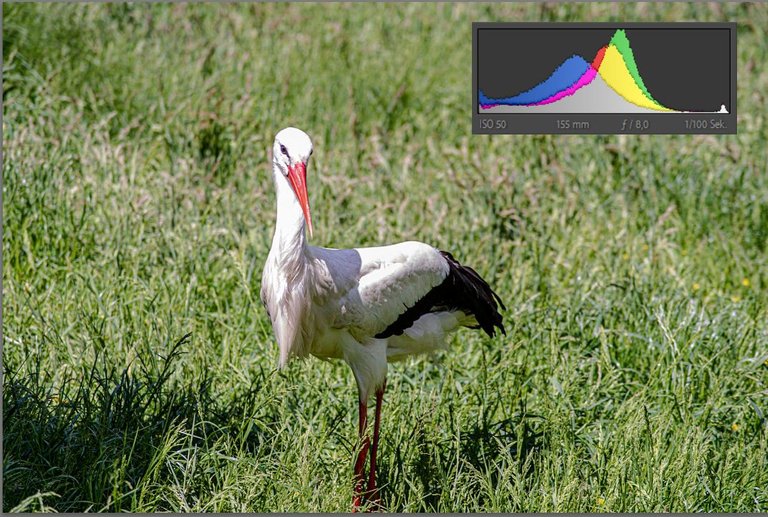
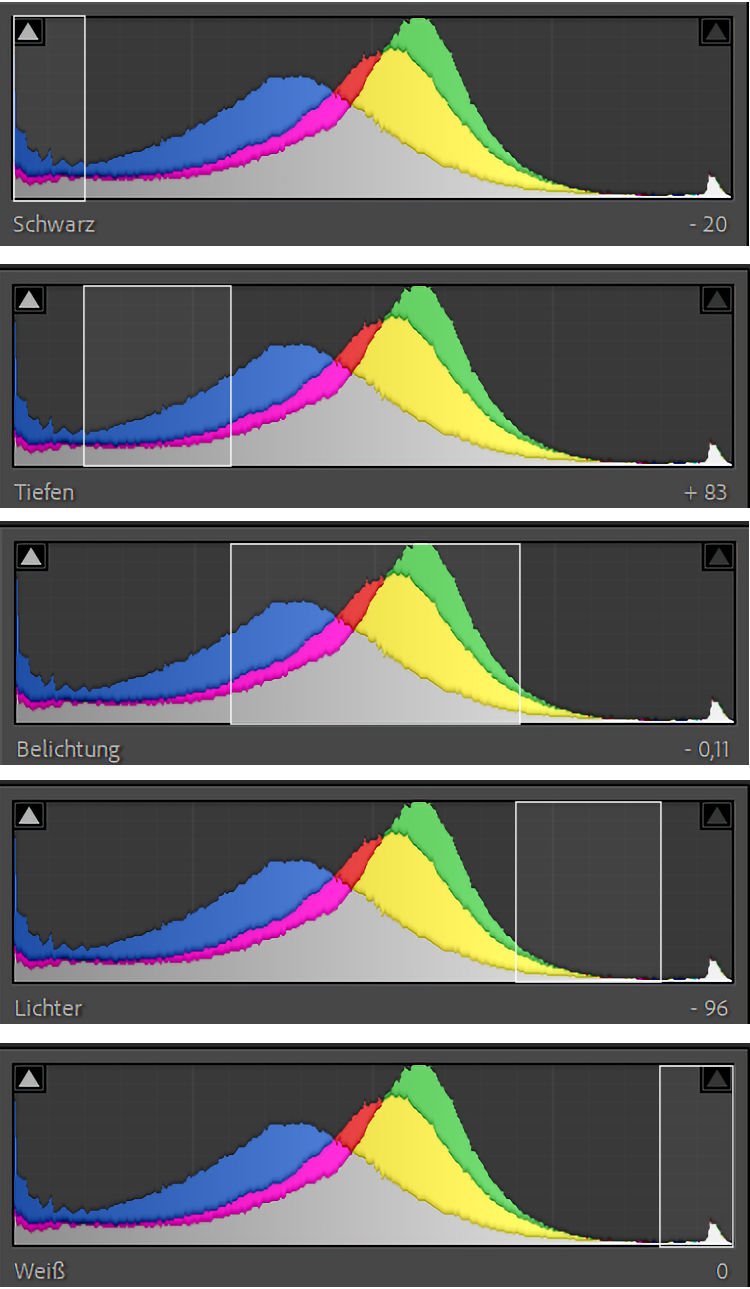
Welche Bedeutung hat dieser "Berglandschaft"? Das Histogramm kann in fünf Abschnitte unterteilt werden, Schwarz, Tiefe, Belichtung, Lichter und Weiß. Schwarz entsprechen dunklen Bereichen in einem Bild und Weiß entsprechen hellen Bereichen. Die Tiefe, Belichtung und Lichter, sind in der Mitte des Histogramms und machen den größten Bereich aus. Auf der x-Achse, horizontal von links nach rechts, ist der Tonwertbereich von vollständig schwarz bis vollständig weiß dargestellt. Auf der y-Achse, also der vertikalen Richtung (von unten nach oben), wird die Frequenz eines bestimmten Tonhöhenwertes angezeigt. Helligkeitsstufe. Je höher der „Hügel“, desto häufiger tritt der entsprechende Tonhöhenwert auf. Auf den ersten Blick mag dies etwas kompliziert erscheinen, doch das ist es nicht. Diese werde ich dir in einigen Beispielen zeigen.
What is the meaning of this "mountain landscape"? The histogram can be divided into five sections, Black, Depth, Exposure, Highlights and White. Blacks correspond to dark areas in an image and whites correspond to light areas. Depth, Exposure and Highlights, are in the center of the histogram and make up the largest section. On the x-axis, horizontally from left to right, is the tonal range from completely black to completely white. On the y-axis, vertically (from bottom to top), the frequency of a particular tone level is shown. Brightness level. The higher the "hill", the more frequently the corresponding pitch value occurs. At first glance this may seem a bit complicated, but it is not. I will show you this in some examples.
Wie Sie die Helligkeit im Histogramm erkennen - How to recognize the brightness in the histogram
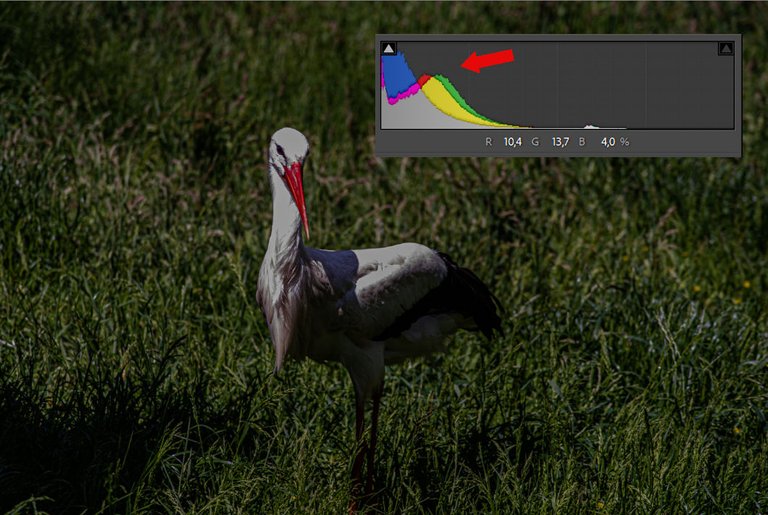
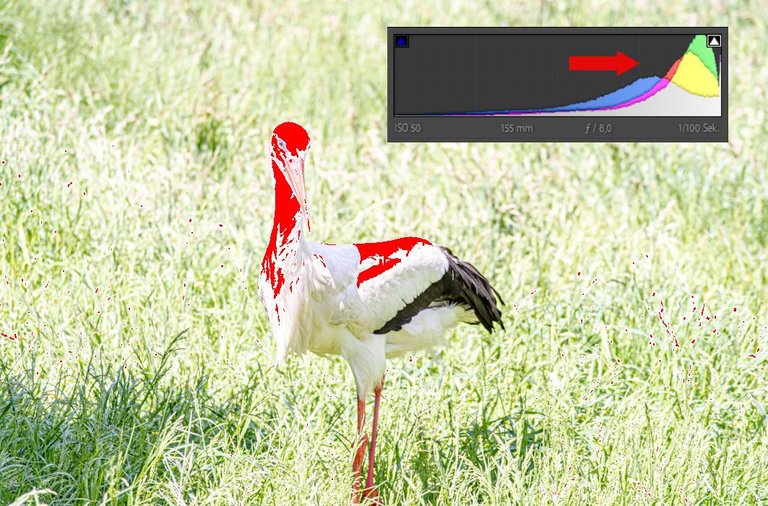
Wir können die gleichen Informationen auch aus dem Histogramm erhalten. Ein großer Berg links zeigt, dass Tonwerte im niedrigen (dunklen) Bereich sehr häufig vorkommen. Rechts, so wie im ersten Bild gezeigt. Das Histogramm sagt uns also, es ist zu viel dunkel ist, der es ist zu viel im schwarzem Bereich. Da dieses Foto zu dunkel ist, müssen Sie die Belichtungszeit erhöhen, den Blendenwert verringern oder einen höheren ISO-Wert einstellen. Hier kommen wir wieder zum Belichtungsdreieck, den Grundvoraussetzung beim Fotografieren.
We can also get the same information from the histogram. A large mountain on the left shows that tonal values in the low (dark) range are very common. On the right, as shown in the first image. So the histogram tells us there is too much darkness in the black area. Since this photo is too dark, you need to increase the exposure time, decrease the aperture value, or set a higher ISO. Here we come back to the exposure triangle, the basic requirement when taking photos.
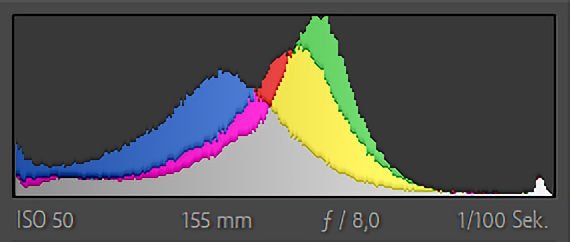
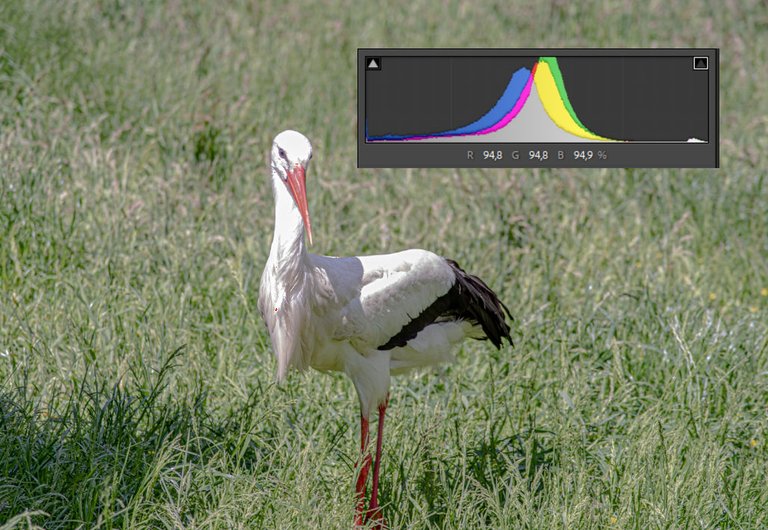
In Bild 2 gibt es im Histogramm nur wenige Häufigkeiten von Dunkeltonwerten und auch im Helltonwerte. In diesem Beispiel befinden sich viele in der Mitte. Alle Details im Bild sind gut sichtbar und die Belichtung ist richtig eingestellt.
In image 2, there are only a few frequencies of dark tone values in the histogram and also in the light tone values. In this example, there are many in the middle. All the details in the image are clearly visible and the exposure is set correctly.
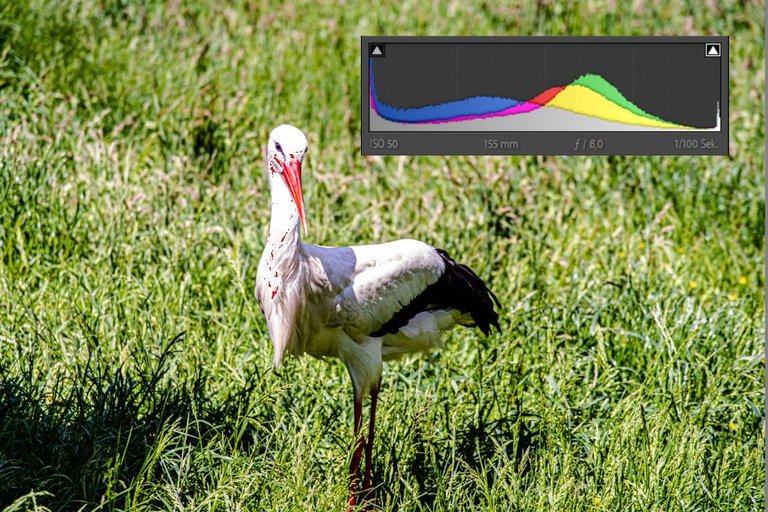
Wie Sie sehen können, ist Bild 3 zu hell. Entweder per Auge oder auf dem Histogramm kann man es genau erkennen. Ich habe die Stellen markiert, die nicht mehr weiß sind, sondern ausgebrannt, das hier befinden sich keine Details. In der Mitte gibt es nur sehr wenige Werte, aber ganz rechts bei den hellen Werten ist ein starker Ausschlag zu erkennen. Das Histogramm erscheint rechts „abgeschnitten“, was darauf hindeutet, dass durch zu hohe Helligkeit viele Bildinformationen verloren gehen. Auch mit einem Bildbearbeitungsprogramm lassen sich die verlorenen Informationen nicht mehr reproduzieren, daher die Bezeichnung „ausgebrannt“. In diesem Fall muss eine kürzere Belichtungszeit, eine höhere Blendenzahl oder ein niedrigerer ISO verwendet werden.
As you can see, image 3 is too bright. Either by eye or on the histogram you can see it exactly. I have marked the areas that are no longer white but burned out, there is no detail here. In the middle there are very few values, but on the far right at the bright values there is a strong deflection. The histogram appears "truncated" on the right, indicating that too much image information is being lost due to excessive brightness. Even with an image editing program, the lost information can no longer be reproduced, hence the term "burned out". In this case, a shorter exposure time, a higher f-number or a lower ISO must be used.
Verwenden des Histogramms in der Kamera - Using the histogram in the camera
Mithilfe von Histogrammen kann die Helligkeitsverteilung eines Bildes während der Aufnahme direkt auf dem Kameramonitor angezeigt werden. Dies ist nützlich, um sich schnell ein Bild von der Helligkeit und dem Kontrast eines Bildes zu machen. Je nach Kameraeinstellungen und natürlich je nach Motiv und Lichtverhältnissen kann das Histogramm unterschiedlich aussehen.
Histograms can be used to display the brightness distribution of an image directly on the camera monitor during shooting. This is useful for quickly getting an idea of the brightness and contrast of an image. Depending on the camera settings and, of course, the subject and lighting conditions, the histogram may look different.
Wie Sie den Kontrast im Histogramm erkennen - How to recognize the contrast in the histogram
Wenn das Histogramm einen großen Peak in der Mitte und fast keine Links- und Rechtskurven hat, ist das ein deutliches Zeichen dafür, dass das Bild zu wenig Kontrast hat. Das Auf und Ab allein reicht nicht aus, mit Details, die Kontraste sichtbar machen. In den 2 Beispielbilder kann man das deutlich erkennen. Das erste Bild hat zu wenig Kontrast und das 2 hat deutlich zu viel Kontrast.
If the histogram has a large peak in the middle and almost no left and right curves, it is a clear sign that the image has too little contrast. The up and down alone is not enough, with details that make contrasts visible. You can clearly see this in the 2 sample images. The first image has too little contrast and the 2 has clearly too much contrast.
Fazit
Das Histogramm ist ein tolles Hilfsmittel, um ein Foto richtig zu belichten und bei der manuellen Fotografie zu unterstützen. Richtig eingesetzt kann es viel Arbeit bei der Nachbearbeitung, viel Zeit ersparen.
The histogram is a great tool to properly expose a photo and assist in manual photography. Used correctly, it can save a lot of work in post-processing, a lot of time.
Das war es wieder von mir, ich hoffe, es hat euch gefallen und wir lesen uns bei meinem nächsten Beitrag. Somit wünsche ich euch noch einen wunderschönen Tag.
Euer
Hornet on Tour
Instagram: https://www.instagram.com/hornet_on_tour/
Twitter: https://twitter.com/OnHornet
Photo: Hornet on Tour (Michael der Knipser)
Translated with www.DeepL.com/Translator (free version)