Analysis of HIVE Using SPSS: The best Time to Buy
This article presents the price analysis of HIVE crypto.
The following are considered in this article;
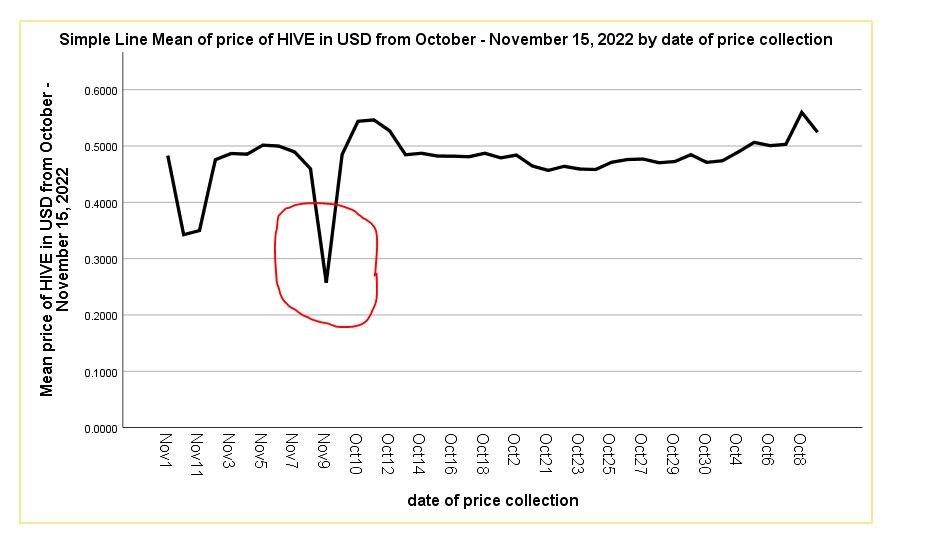
Line graph
The line graph shows the performance of HIVE price. As it can be seen the dip circled indicates now is a good time to buy some HIVE. To buy HIVE.
Box plot
The box plot indicates the general price of HIVE in a normal situation. The prices are shown within the box.
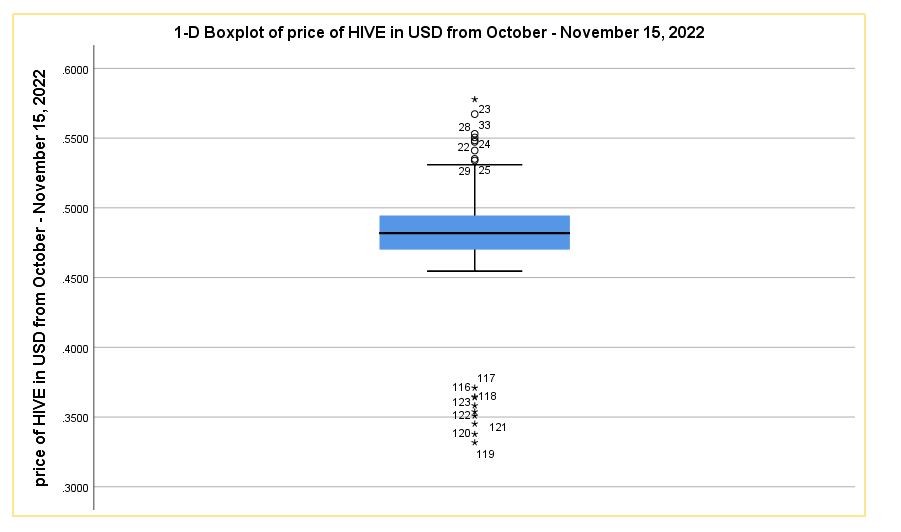
For prices that are too low or extreme is been represented with asterisk. This also indicates the price of HIVE has gone low from the usual which is an indication to buy.
Maximum and minimum price of HIVE
The maximum and minimum price of HIVE can be seen in the table below.
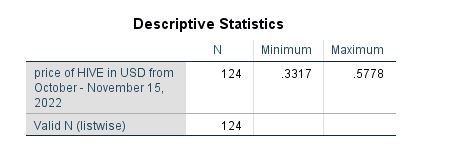
It gives a better understanding to what level the price of HIVE has fallen to.
Conclusion
This is article has been able t present a descriptive analysis of HIVE price indicating a good time to buy when the price of HIVE is low.
Thanks for reading.
https://twitter.com/1455313948425732098/status/1593112251627884545
The rewards earned on this comment will go directly to the people sharing the post on Twitter as long as they are registered with @poshtoken. Sign up at https://hiveposh.com.
This post has been manually curated by @bhattg from Indiaunited community. Join us on our Discord Server.
Do you know that you can earn a passive income by delegating your Leo power to @india-leo account? We share 100 % of the curation rewards with the delegators.
Please contribute to the community by upvoting this comment and posts made by @indiaunited.