Bitcoin And Elrond (Btc vs EGLD)
Bitcoin has influence some altcoins in terms of price. However, this article will examine if bitcoin has some correlation with other token in terms of price. This article will compare the price of bitcoin and that of Elrond token.
This article will analyze the relationship between the price of bitcoin and Elrond token.
Objectives Of The Study
In the course of this article, I shall tend to cover the following subtopics under this test of both token prices.
Theories of the analysis.
Under this analysis, the result will be interpreted in any of the listed terms below.
Positive relationship
The relationship between the price of bitcoin and that of Elrond is positive indicating that as the price of bitcoin goes up the price of Elrond (EGLD) goes up as well.
Negative relationship
The relationship said to be negative when the price of bitcoin goes up and that of Elrond (EGLD) goes low. It is opposite of the positive relationship.
Zero relationship
Zero relationship indicates that there is no link between the price of bitcoin and that of Elrond.
This test uses letter “r” to indicate the category in which the relationship falls into.
For a positive relationship r = 1 or tends towards a positive 1 axis.
For a negative relationship r = -1 or tends towards a negative 1 axis.
For zero relationship r = 0 or tends towards the zero axis.
The relationship is essential to identify if the price of bitcoin progress alongside with Elrond token.
It is also essential to indicate the strength of relationship if it’s a weak one or a strong one.
The relationship test is also essential to predict what shall be the future hope of both prices if one goes high.
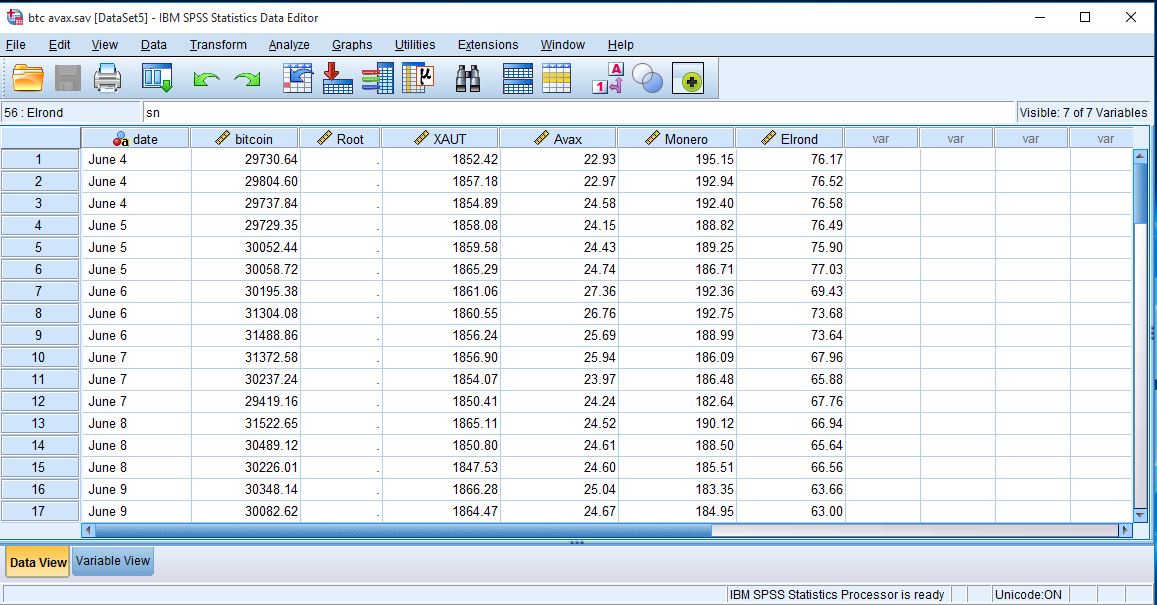
I shall attempt to collect data from coingecko.com as regards the price of bitcoin and that of Elrond for the period of June 4 – June 22, 2022.
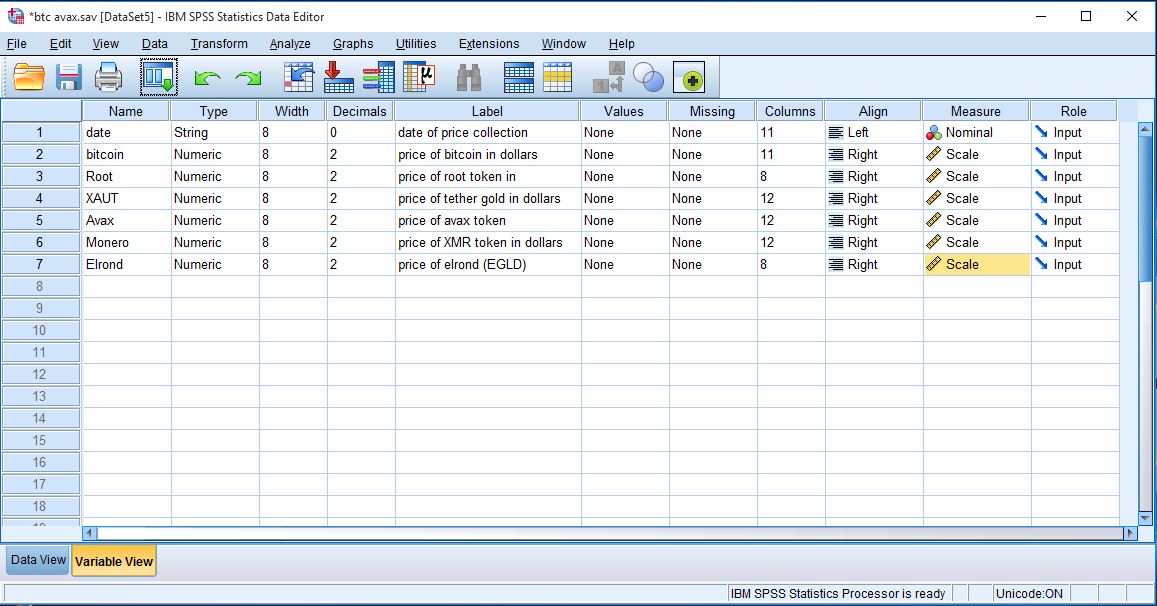
The price of bitcoin are the second and the seventh variable in the variable view mode of spss.
The prices are further arranged in a data view mode of SPSS software.
From the analysis of both prices, we shall attempt to consider running a scatter dot diagram.
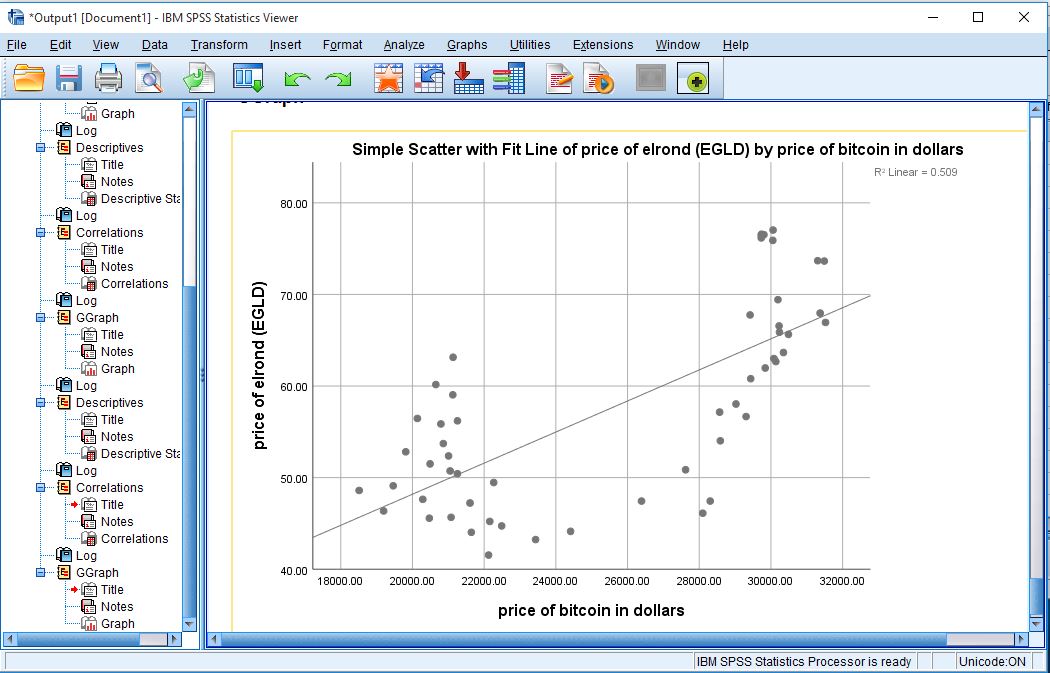
From the scatter dot diagram, we can consider a positive relationship.
When you consider the relationship, you view a slanting line. This line host both dependent and independent on vertical and the horizontal axis.
Considering the slope showing the intercepts of the point when you trace any axis on the bitcoin axis, it can derive a value when it is traced to the Elrond axis.
Result
The result of correlation is interpreted on a scale from -1 to +1.
-1 --------------------------0------------------------+1
As it tends towards any of the axis, the correlation coefficient r must lie on any of the points.
The result of the analysis shows that the coefficient of correlation r= 0.7 indicating it’s close to positive 1 axis. As the price of bitcoin goes high, the price of Elrond does same.
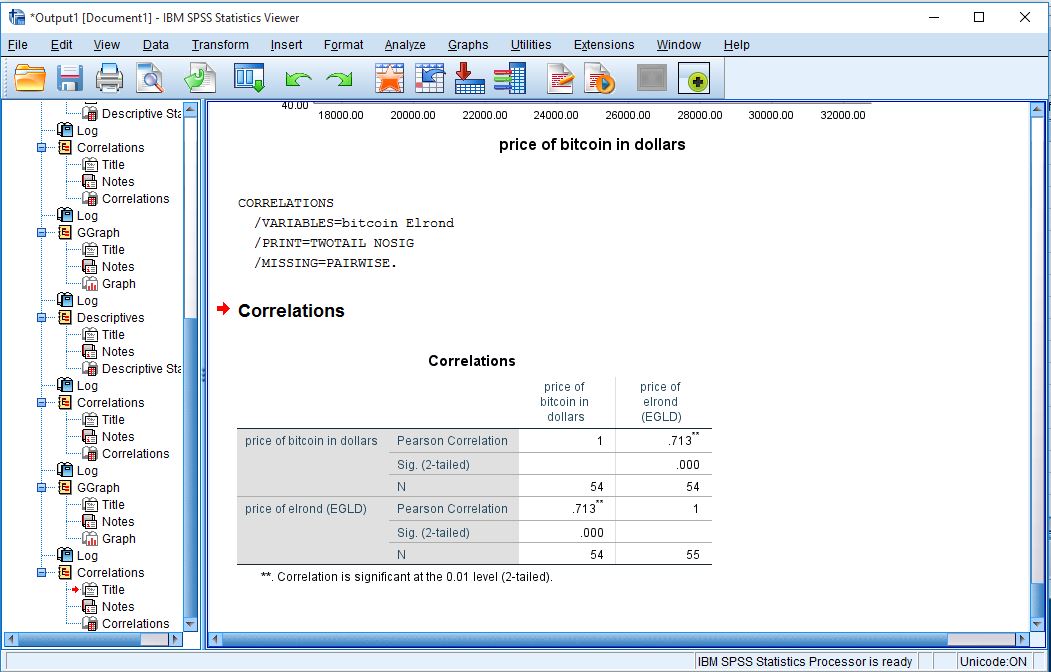
If bitcoin experiences a dip, Elrond token will also experience same thing.
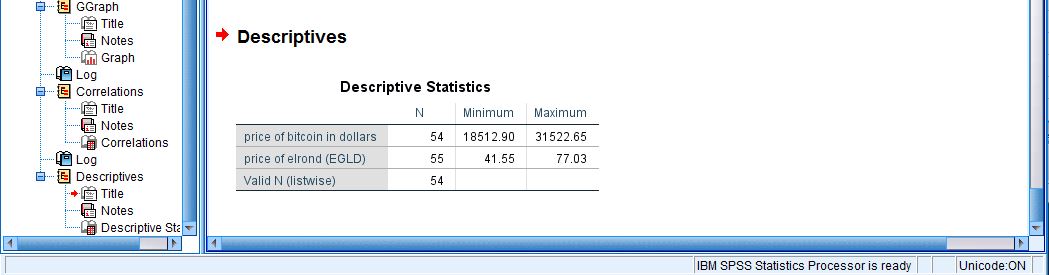
The maximum and minimum price of both tokens are revealed below