Correlation Between BINANCE and HIVE
This article tends to explore an analysis of correlation between BNB and that of HIVE updated for the last two months of 2022.
Correlation analysis of crypto prices tends to identify the type of relationship between two assets. The relationship is grouped into two aspect namely positive and negative correlation. There can also be a no relationship between assets.
A positive relationship indicates that as the price of BNB is in a bull market, the price of HIVE will also be in the same state and if it’s in a bear market, the price of HIVE will replicate same. This implies when the price BNB increases in value, same will be replicated on HIVE.
This type of relationship (positive) tends to be on a numbers scale range of 0 to positive 1 axis. The coefficient of correlation is usually positive in this case.
A negative relationship indicates that when the price of BNB is in a bear market, that of HIVE will also be in a bear market. This alternatively means if the price of BNB is on a low price, the price of HIVE will be on a high price. The coefficient of this relationship lies between 0 and negative 1 axis.
However, the type of relationship between BNB and HIVE is positive with a coefficient of 0.864.
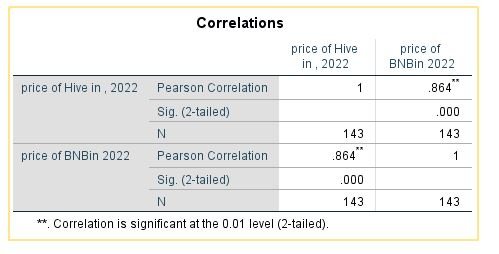
this is an indication that when the price of BNB is in a bull market, the price of HIVE is likely going to replicate same condition, hence when the price of BNB increases that of HIVE will also increase and vice versa. To predict the next Bull Run in the price of HIVE, we can watch for a bull in the price of BNB.
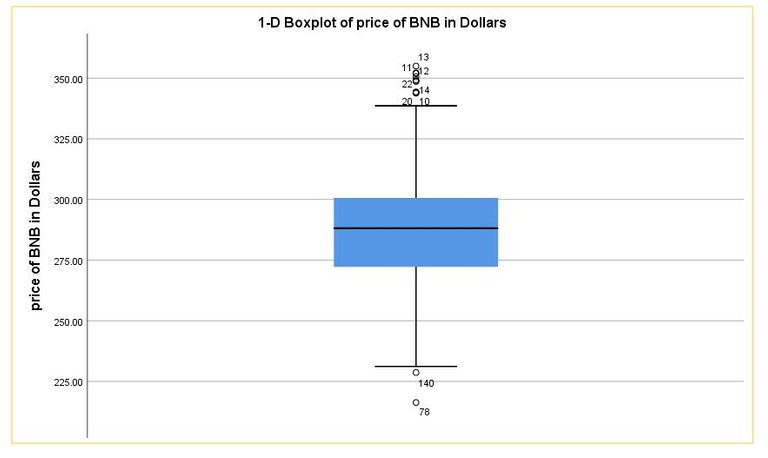
Boxplot of BNB and HIVE Price
Below is a diagram showing the boxplot of BNB and that of HIVE price.
BNB
The range of price of BNB is in between the range of $350 to $325 for highest price and $250 to $225 for low price during the period of November to December 2022.
HIVE
The boxplot for hive is seen below between the range $0.4 to $0.35 for highest price and $0.35 to $0.3 for lowest price.
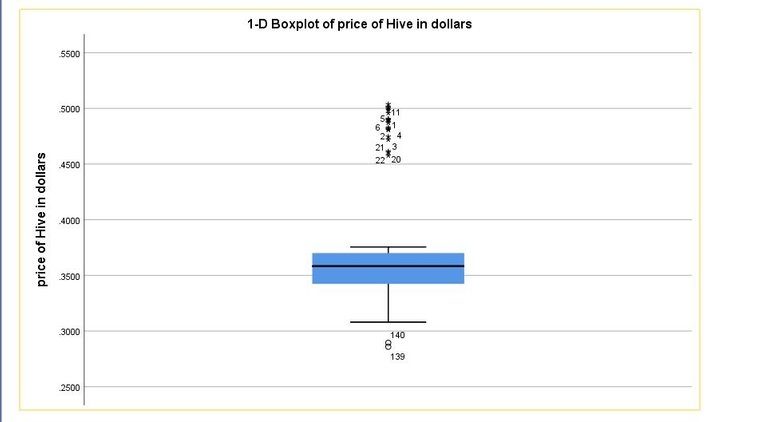
The indication of numbers above and beneath the boxplot identifies when there are extremely high price of HIVE or BNB in the time frame considered.
Data works
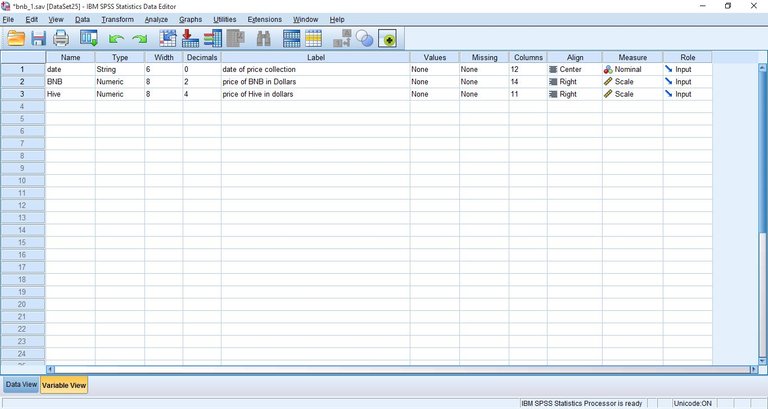
Below is a data and variable view showing how this research was carried out.
The data view indicates the price entry for BNB and HIVE in a three rows.
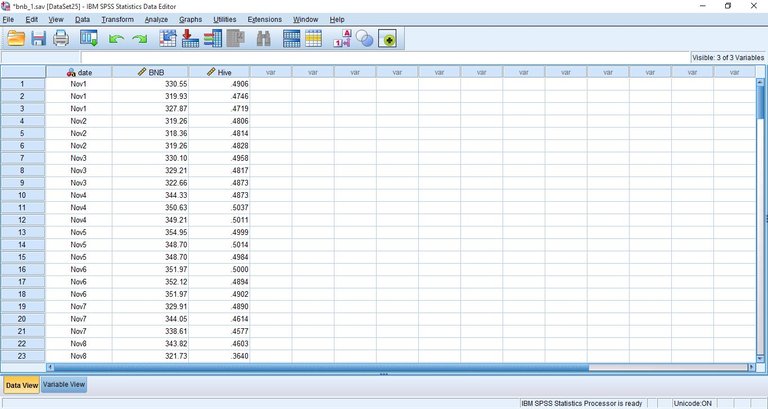
The variable view indicates the backbone through which the analysis is been built. It also shows variable settings for entry of both asset prices.
Conclusively
This article has been able to measure the performance of BNB and HIVE simultaneously using SPSS. However there is a form of positive correlation between both assets indicating as the price of BNB increases, the price of HIVE will likely increase. This also implies that if there is a decrease in the price of BNB, the price of HIVE will experience same on its network.
Posted Using LeoFinance Beta
Thanks for the analysis and neat presentation of data! 😊
Were you able to account for any portion of the remaining ~13.5% of variation between the two? In either case, that's a hopeful sign, because BNB is one of the largest, most active cryptocurrencies around. Should the correlation continue at a similar level, that would imply that Hive is also a very active cryptocurrency with a strong userbase. With continued growth, it might become even stronger.
The statistics showed a maximum positive correlation.