Correlation of Bitcoin and HIVE
Since Bitcoin is the king in the crypto market, it is essential to measure the level of correlation with HIVE. The data of this result were gotten from coingecko.com with data samples of each asset price ranging from January 1 to February 15th, 2023.
In this analysis I will present the relationship between BITCOIN and HIVE under the following subtitles.
Correlation coefficient of Bitcoin and HIVE
The coefficient of correlation describes the type of relationship that had existed during the above stated period.
As explained in previous content, correlation coefficient value can either be a positive (strong or weak), negative (strong or weak) or zero. When it is zero, it indicates that no relationship between both assets in the crypto market.
A positive relationship indicates as the price of one asset (BTC) is on the pump side, it’s more likely that the price of the other (Hive) will be on the pump according to their different price levels.
When there is a negative relationship indicates that as the price of Bitcoin experiences a pump that of Hive will be a dump. This will lead to determining the type of relationship that had existed between the two considered assets.
From the analysis as seen below, coefficient of correlation is 0.863, this indicates a strong positive correlation between the Bitcoin and Hive.
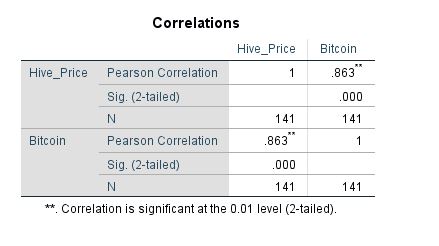
For investors, it is interpreted as: increase or decrease in the price of Bitcoin, positively effects in the price of Hive to be increased as well.
Line graph of Bitcoin
The line graph of Bitcoin is as shown below.

There were a lot of speculations in the crypto market that Bitcoin may likely never go back to its all-time high of estimated $72,000 due to influence.
Right now what happened to bitcoin, proves that it seems the whales may be out of its investment market for now but I have this speculation having considered the line chart that it may definitely reach the $72000 price side but might take a little time to achieve this again.
The graph presents the idea that bitcoin started the month of January with estimated value above $15000 and aims it way over $20,000 to near hit $25,000 within the duration of January to February, However, if conditions remains same, It may likely achieve halfway of its all-time high again.
Line graph of HIVE
The line graph of Hive is presented below.
In the early week of the month of January, it can be seen that Hive aimed above 3 cents.
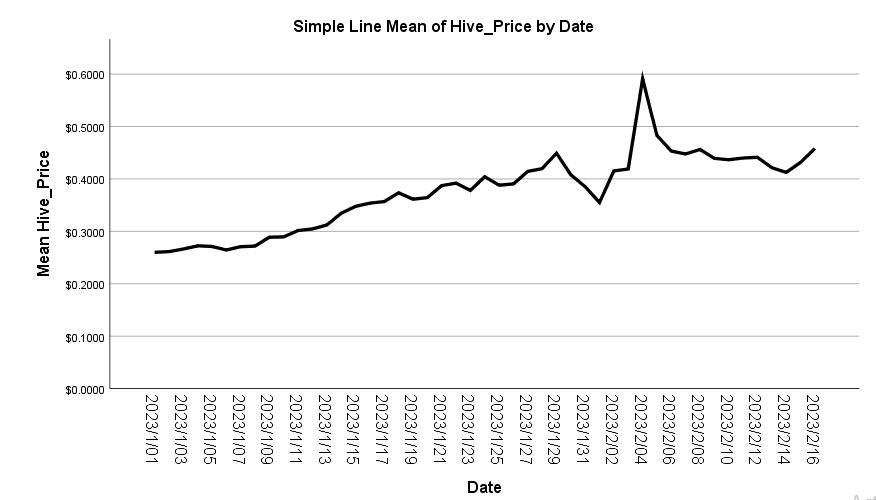
From the chart, it estimated above 4cents towards the ending period of January 2023. Though there was a fall in the price again in February early week.
However hive stands out to have a spike in its price to 6 cents. Right from that period till the second week of February, Hive has been slowly aiming at 5cents.
Highest And Lowest Price of Asset
The highest and lowest price of Bitcoin and Hive is derived from the table presented below.
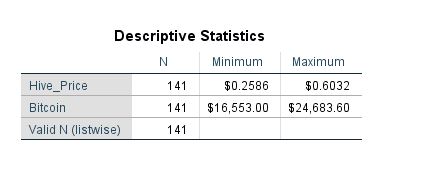
During the duration stated above, the highest price of Bitcoin was estimated to be $24683.6. However from the line graph, it can be visualized that BTC aims a $25000 near hit.
Conclusion
This article summarized the type of relationship between bitcoin and Hive to be positive and strong. It is most likely known that as bitcoin continues to gain momentum in price it will also be replicated in Hive which may estimate $1 per hive.
Thanks for reading, this article is open to suggestions and critics for better improvement.
https://twitter.com/1455313948425732098/status/1626399938325143554
The rewards earned on this comment will go directly to the people sharing the post on Twitter as long as they are registered with @poshtoken. Sign up at https://hiveposh.com.