ETHEREUM Price Performance Analysis
This article is a brief summary of ETHEREUM (ETH) performance within the month of June – October, 2022. Details of descriptive analysis of ETH price is been considered in the content below.
It shall be considered under the following subheading;
Line graph Of ETH Price.
Bar chart showing the price of ETH.
1D Boxplot Showing ETH Price.
Maximum and minimum price of ETH.
Conclusion.
Line graph Of ETH Price
The line graph of ETH price from the month of June – October is as represented below.
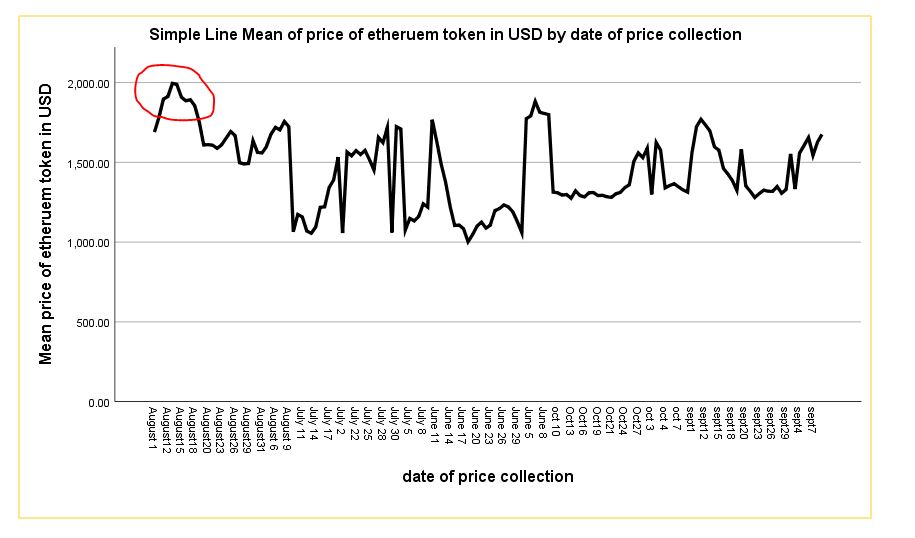
It can be seen that in mid August, 2022, the price of ETH attempted $2000 per coin. More details of ETH price performance is seen in the bar chart below.
Bar chart showing the price of ETH
The bar chart gives details of line graph analysis.
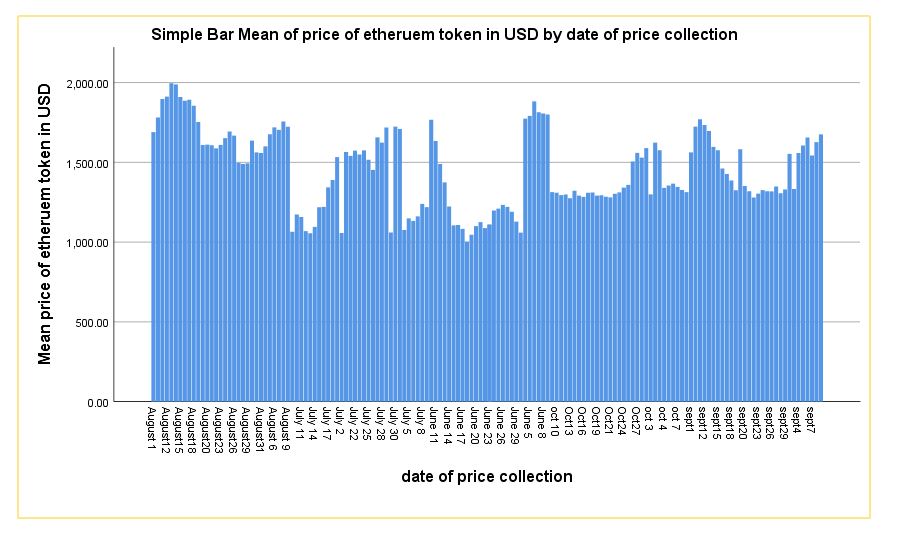
It is visible that in the month of June , July , August and September, the price of ETH attempted to scale of above $1500. The boxplot diagram will represent the price interval of ETH within the specified month.
1D Boxplot Showing ETH Price
The boxplot diagram showing ETH price is as seen below.
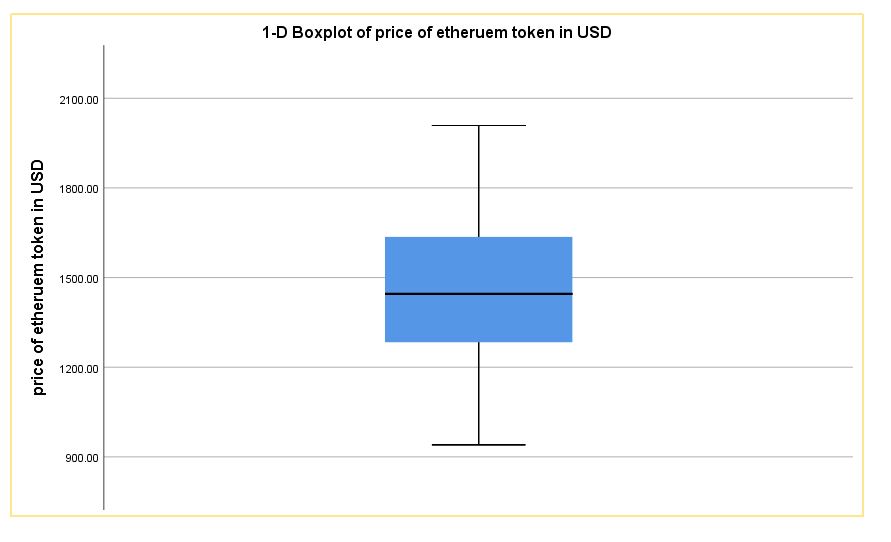
However the price range between the five months period was within $2100 to $1800 for high price and $900 - $1200 for low price. Detailed explanation of the boxplot will be seen in the maximum and minimum table.
Maximum and minimum price of ETH
The maximum and minimum price of ETH is been displayed in the table below.
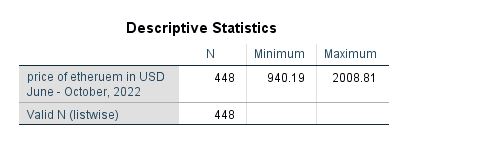
It can be seen that the highest price of ETH was $2008.81 and $940.19 for low price.
Conclusion
This article has been able to present price analysis of ETH, descriptive statistics showing line graph, boxplot and bar chart of ETH was also presented in this article.
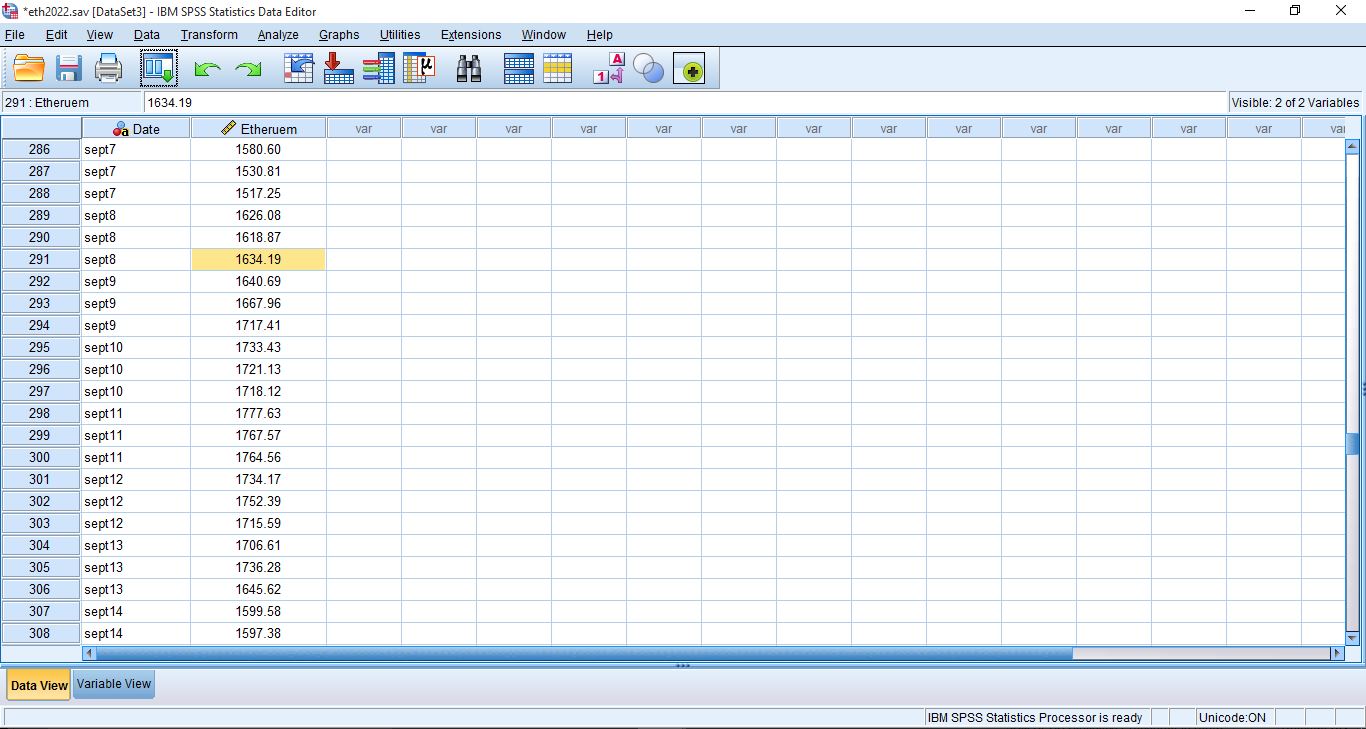
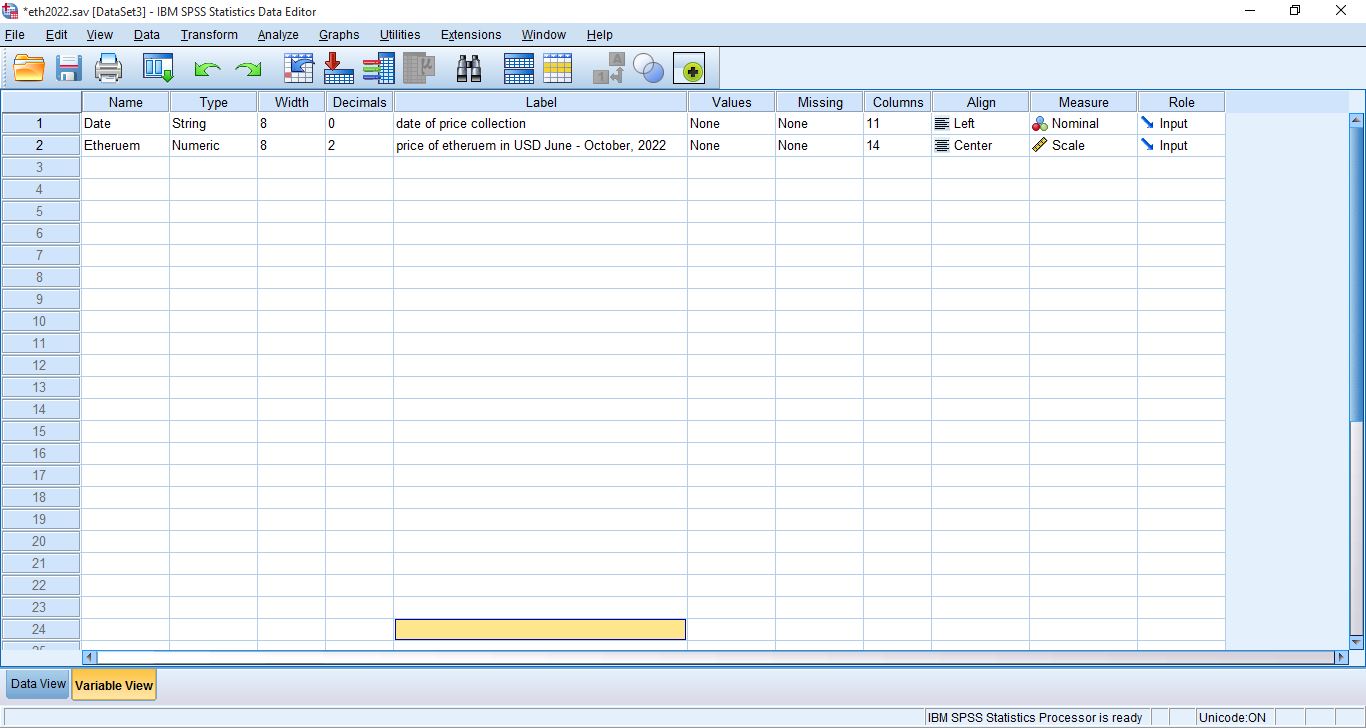
Other relevant images for this article are Data view and variable view
Data view
variable view
Thanks for reading.
https://twitter.com/1455313948425732098/status/1596046725344800769
The rewards earned on this comment will go directly to the people sharing the post on Twitter as long as they are registered with @poshtoken. Sign up at https://hiveposh.com.