HIVE Price in Early 2023
Hive has been one of the thriving asset in the first quarter of 2023, this article will analyze its price performance for the month of January 1st 2023 to February 18th, 2023 under the following sub categories.
Q - Q Plot for HIVE Price
The main essence of Q- Q plot is to measure normality.
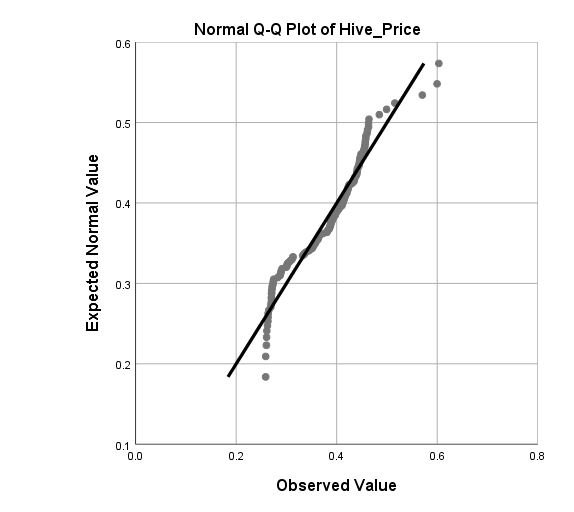
The normality chart shows if the data is obtained from a population or not. Data from a sample of the population usually follows the diagonal line (dotted points) from the chart over 80% of Hive price follows the diagonal line, therefore it is normal and sufficient to generate meaningful or valid findings.
Boxplot for HIVE Price
The box plot diagram shows the extent to which HIVE price ranged within the stated period.
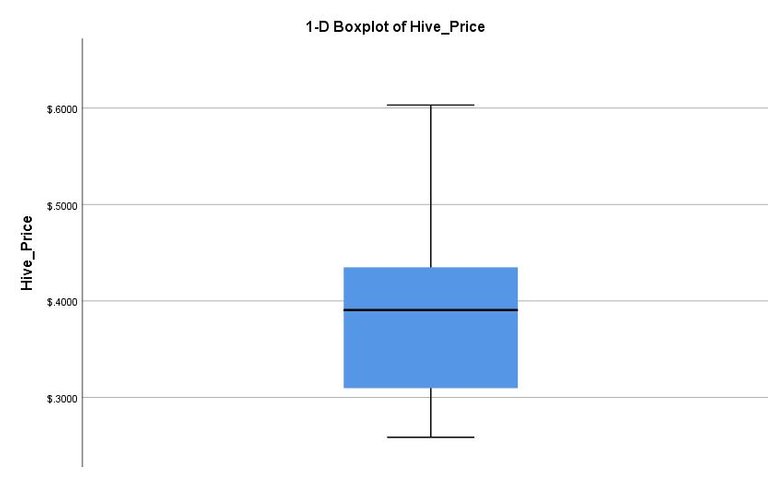
The time range considered is from january1 – February,18. However, it has been in the range of below 0.3 cents to above $0.6. it can also be called a volatility graph of hive showing extreme prices.
Line graph for HIVE Price
The line graph for HIVE shows its price performance as similar to the bar chart.
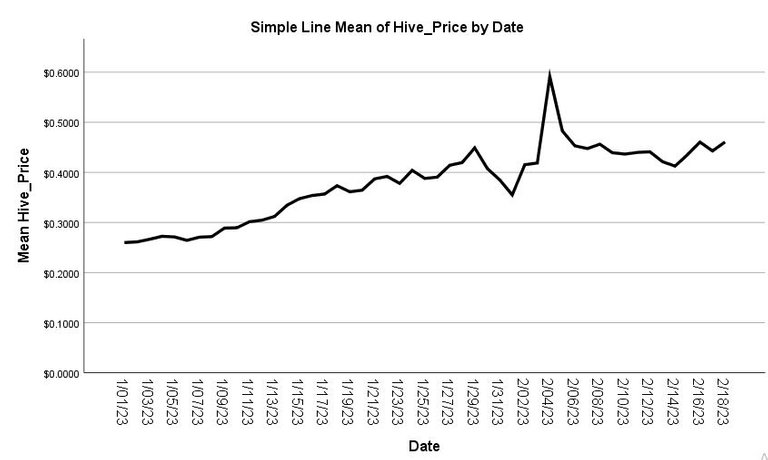
It can be visualized that the ending period for January was when HIVE began to recover from the dip.
HIVE bar Chart for HIVE Price
The bar chart is similar to the line graph as explained above.
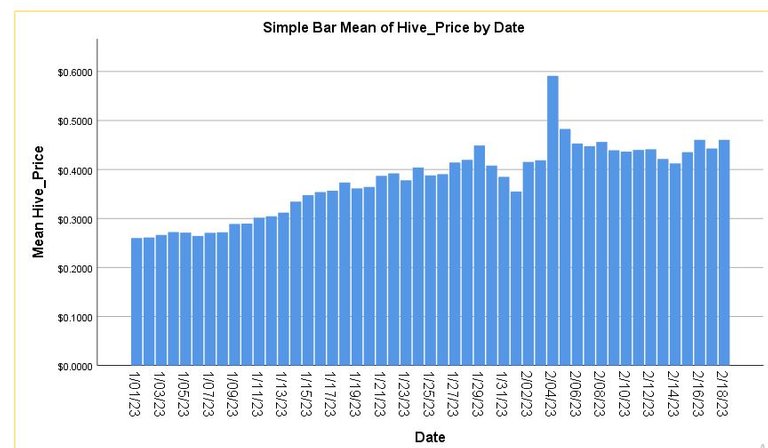
Maximum and Minimum price of HIVE
The maximum and minimum price of HIVE is presented in the chart below.
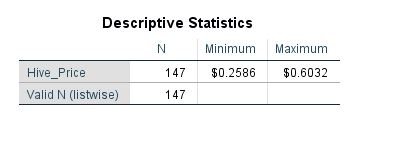
The maximum price of HIVE was $0.6032 and lothe west price was $0.2586.
It can be seen that during the period, HIVE began to experience increase in its price in the second week of January the month of February 18th. This has been an advantage for investors and still permit room for investment as the price finds its way to estimate a dollar.
HIVE Data
The data for this analysis was gotten from coingecko.com and entered into SPSS for analysis.
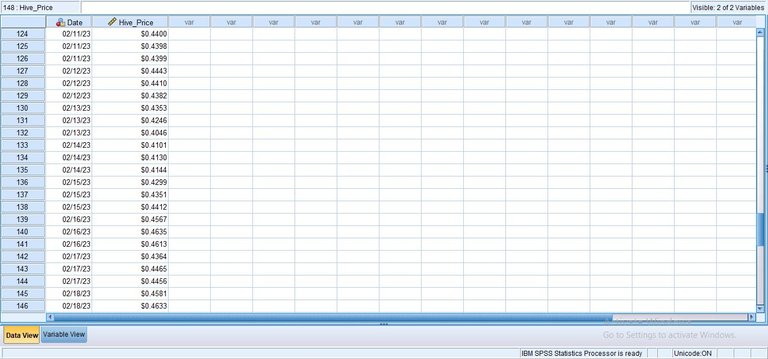
The data contains HIVE price from the month of January 2023 – February 2023.
Conclusion
In summary terms, as major assets begins to experience the bull price, it also influence the price of HIVE increasing its value from the descriptive analysis presented in this article which includes the boxplot, line graph, maximum and minimum values for HIVE and normality plot.
Posted Using LeoFinance Beta
https://twitter.com/1455313948425732098/status/1626862008757805058
The rewards earned on this comment will go directly to the people sharing the post on Twitter as long as they are registered with @poshtoken. Sign up at https://hiveposh.com.