Price Analysis Of ETHEREUM (ETH) and BINANCE (BNB) Using SPSS
In the last article, I analyzed the relationship between BTC and ETH relationship. There seem to be a positive and strong relationship between both assets. In this article, I will consider the relationship trend between BNB and ETH inclusive of BTC under the following points.
Note this analysis is for the month of October, 2022.
Result of correlation analysis between ETH and BNB
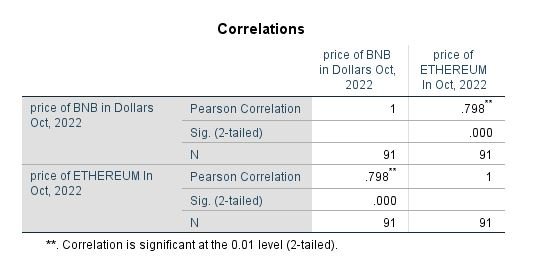
The result of analysis shows the coefficient of correlation between BNB and ETH is 0.798. This shows a strong positive correlation indicating as the price of ETH experiences a pump; same thing will be for BNB price and vice versa.
The table as presented above from the significance value of 0.00 which is way to less than 0.05, we reject the null hypothesis that there is no relationship between both assets.
ETH And BNB Plot
Below is a plot of the price of BNB and ETH in October, 2022 which defines in clearer terms the correlation without a line of intersection.
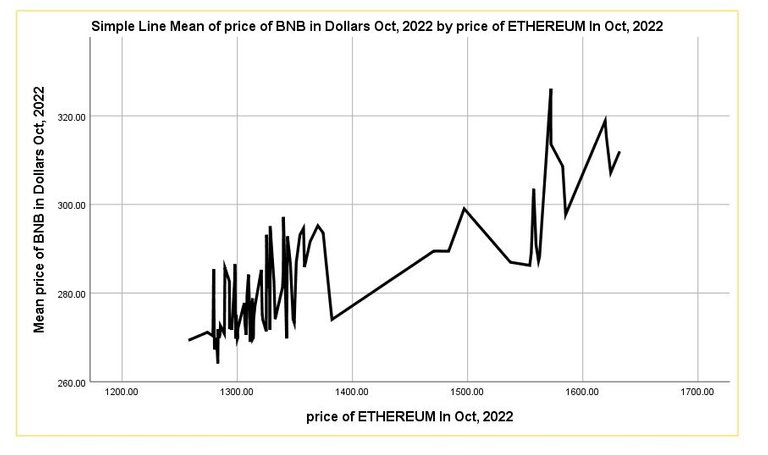
It is visible that for every price of ETH, there is a corresponding price of BNB.
Scatter dot diagram for ETH and BNB
The scatter dot diagram for BNB and ETH shows ETH is useful in predicting the price of BNB having considered the diagonal line of intersection.
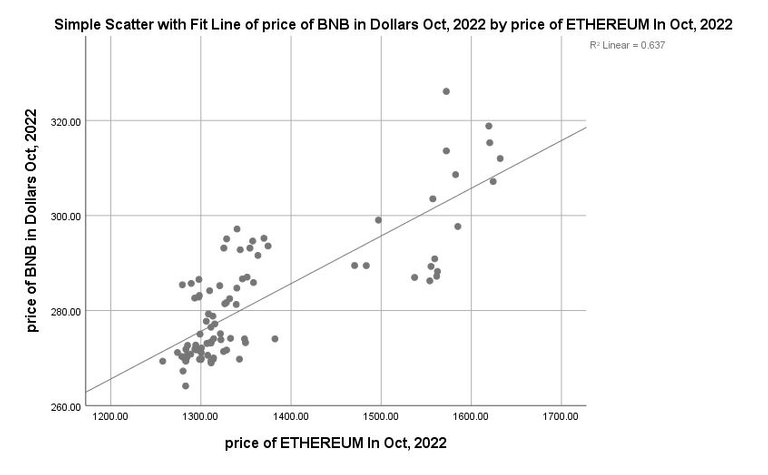
If we include more values of ETH and BNB, we will be able to predict the price of BNB when that of ETH is known for future purposes.
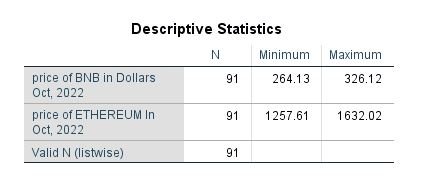
Maximum and minimum price of ETH and BNB
The maximum and minimum price of ETH and BNB is been presented in the table below.
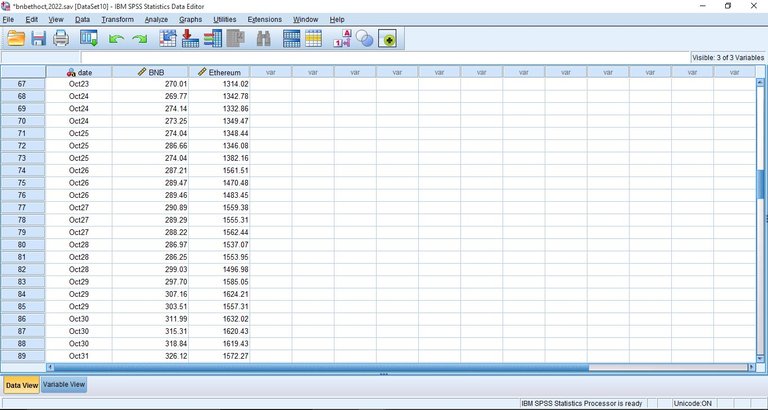
Other images included in this analysis
Other images included in this analysis are data and variable.
 !
!
Conclusion
This article has been able to present the correlation between the price of BNB and that of ETH. It is seen that there seems to be a positive correlation in the trend between BTC >> ETH>> BNB.
Thanks for reading, do have a happy Sunday.
Posted Using LeoFinance Beta