Testing For Correlation Between Chain Link (Link) And Leofinance (wleo) Assets (June4 – September 22, 2022)
Statistical analysis cannot be neglected as it provides meaningful details to data. This article will present the type of relationship that exist between link and leo asset.
It shall be treated under the following categories
Result of analysis
I did not really dwell on what correlation is all about because I have been carrying out series of correlation test in previous articles, explaining an introduction to correlation.
The result of correlation analysis between link and leo can be seen below.
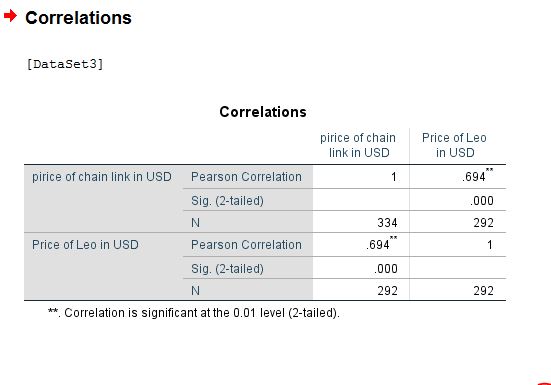
However, it can be said that there exist a positive relationship between both assets as their coefficient of correlation is ( r = 0.694). this relationship is positive and strong.
A positive relationship indicates that as the price of link goes high, that of leo will also increase simultaneously and vice versa in the crypto market.
Now this type of relationship is a strong one because according to the founder of correlation test, Karl pearson, he stated that the closer the coefficient to the positive 1 axis the stronger the relationship.
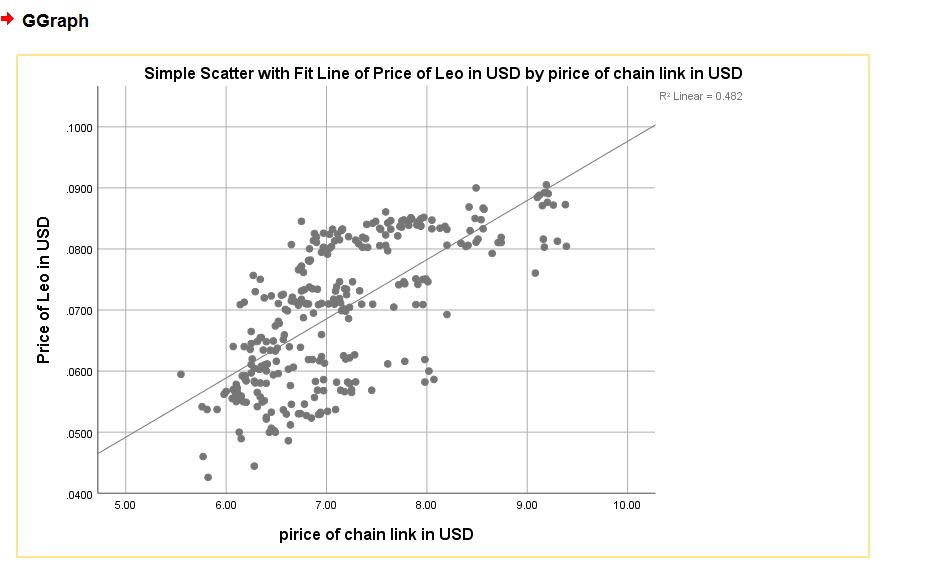
The scatter dot diagram below explains better interpretation. It can be a strong correlation occurs when the diagonal line is closer to the point of intersection between both axes.
Conclusion
This article has been able to visualize the type of relationship that exist between the asset of chainlink platform (link) and also Leofinance token (wleo). In my next analysis, I will find out the prediction model.
Other images includes
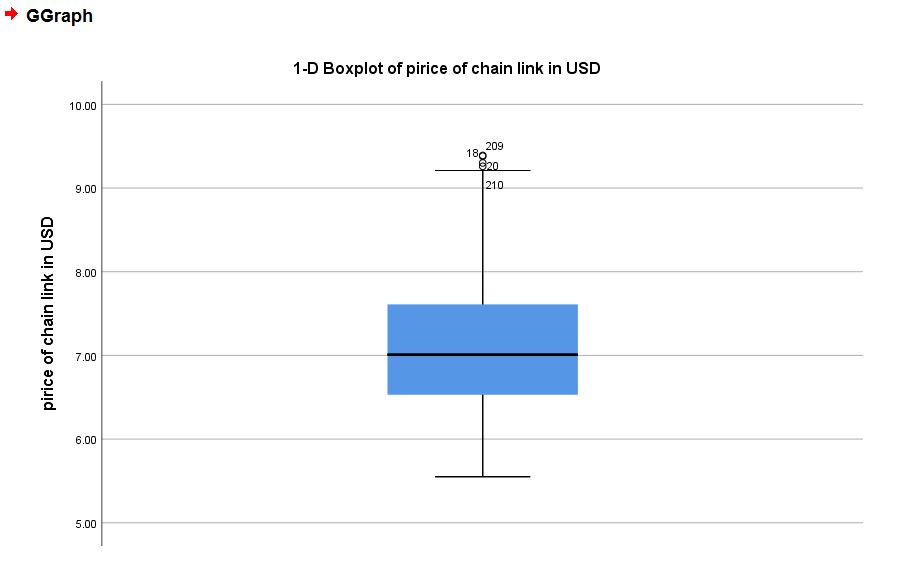
Boxplot for chainlink
Boxplot for leo
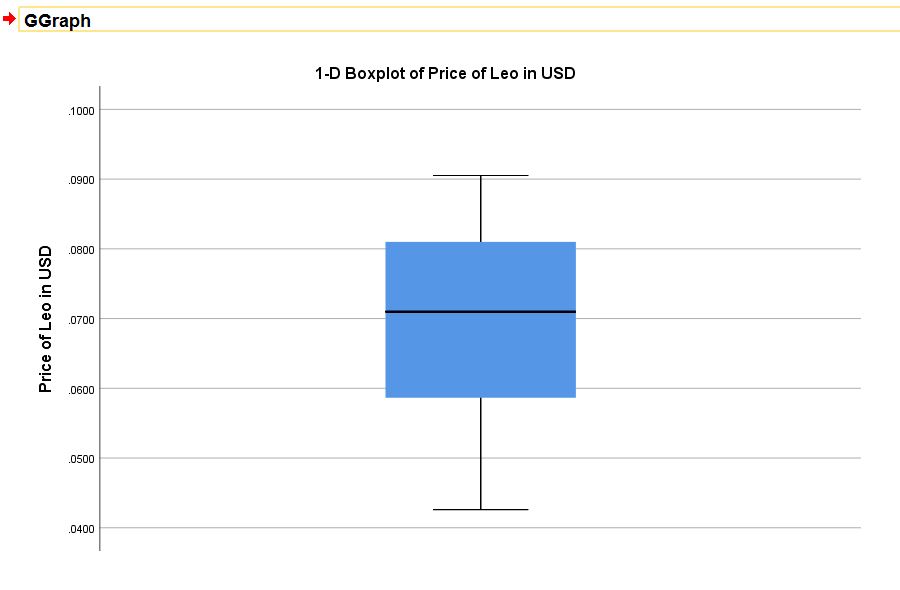
Boxplot shows the performance of both asset prices within a specific time period.
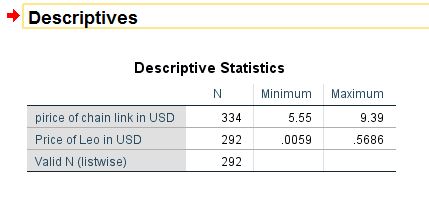
Maximim and minimum prices for the stated period
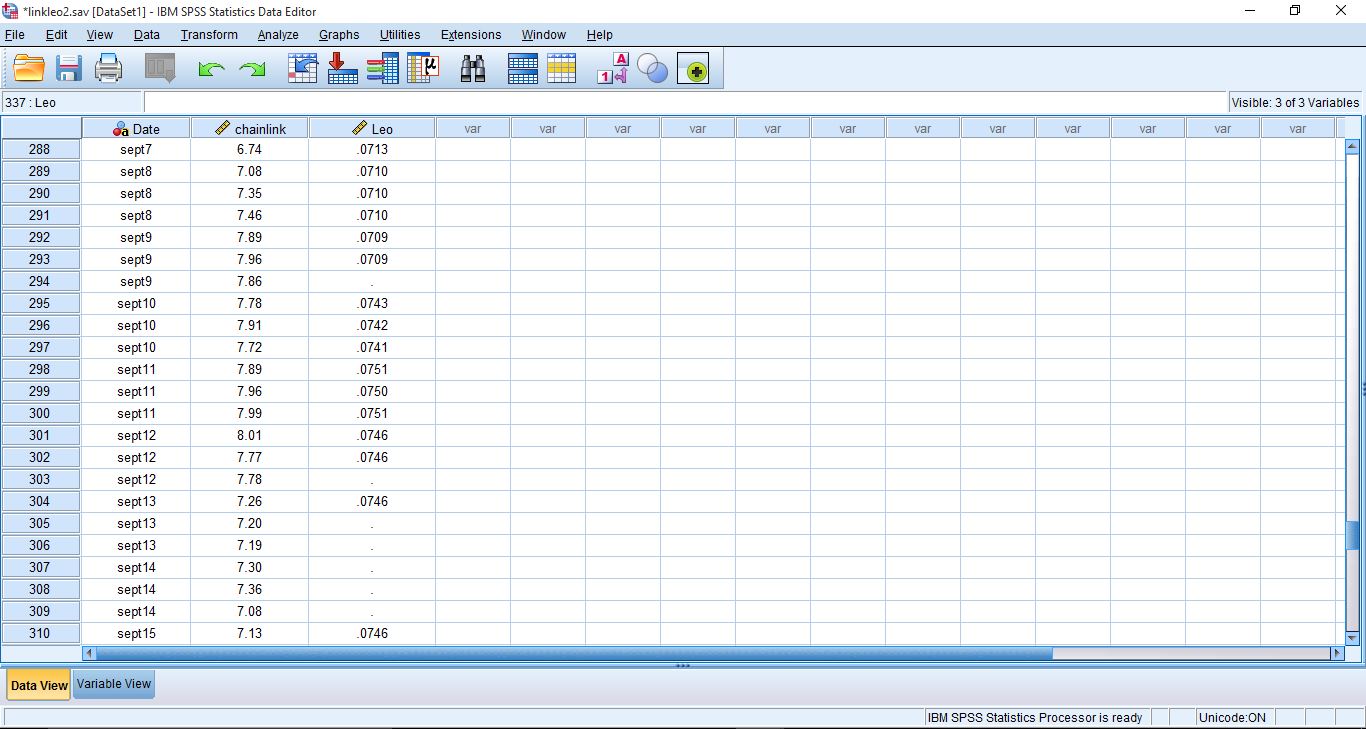
Data view mode
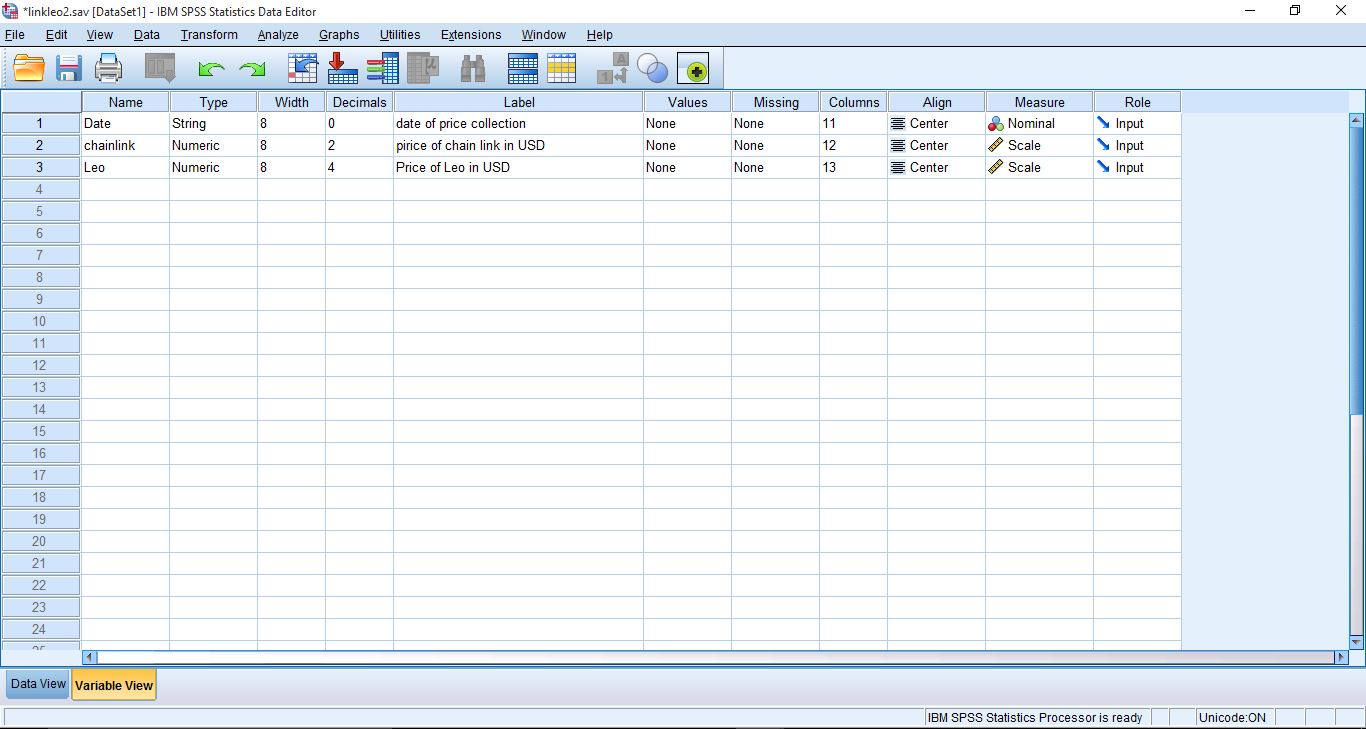
Variable view mode
Thanks for reading