LeoFinance Weekly Stats 03/20/2023 to 03/26/2023
Welcome to the weekly edition of the LeoFinance stats report.
This is a weekly report covering March 20 through 26, 2023.
If you want to learn a bit more about the LeoFinance ecosystem and dig into the numbers, this is the place to be.

The following topics will be covered:
- Issued LEO Tokens
- Top LEO Earners
- Rewards to HP delegators trough the leo.bounties program
- Daily stats on tokens staking
- Share of tokens staked
- Top Users that staked
- Unique number of LeoFInance users
- Posts/comments activities on the platform
- Posting from LeoFinance.io interface
- Price Chart
Issued LEO Tokens
Let’s take a look into token issuance and how it is distributed over time.
Below is a chart that represents the cumulative issued LEO tokens.
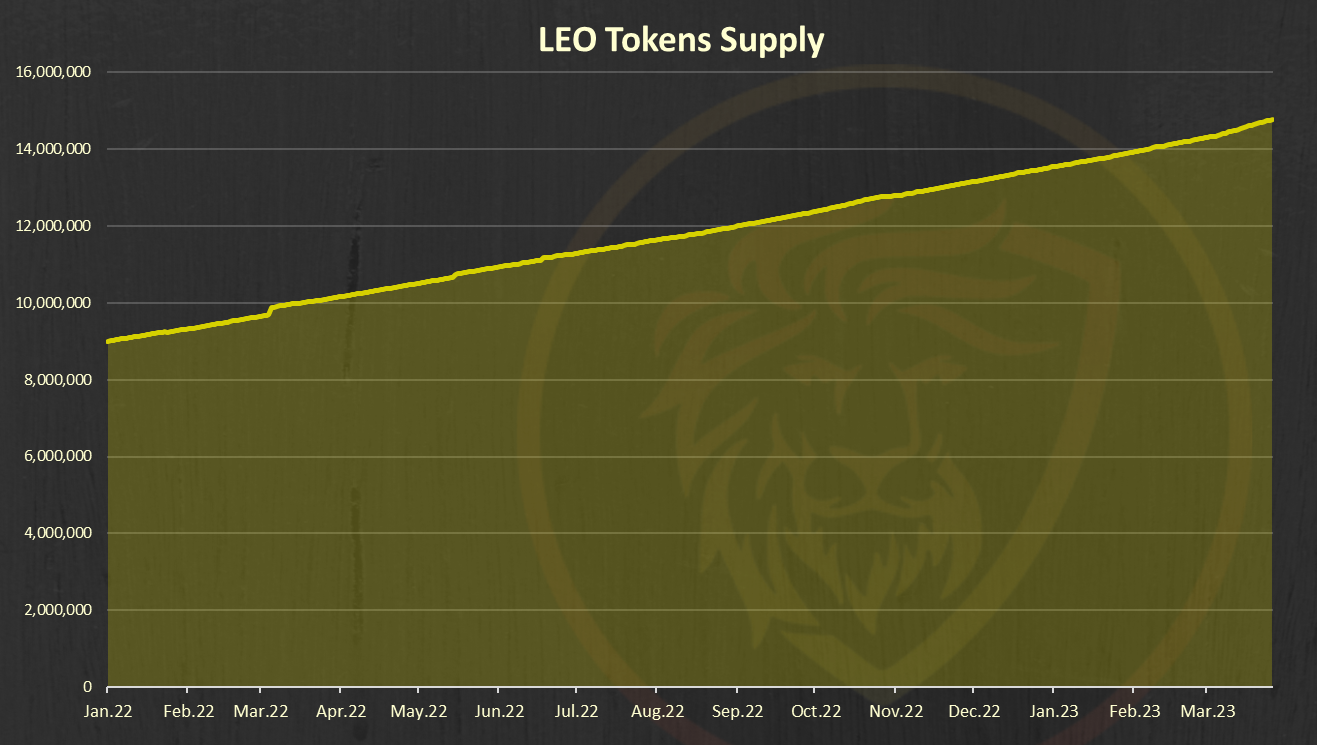
This chart is representing the total LEO supply, circulating supply and burned tokens.
A total of 14.8M circulating supply.
Next is the issued LEO tokens from last week. Here is the chart:
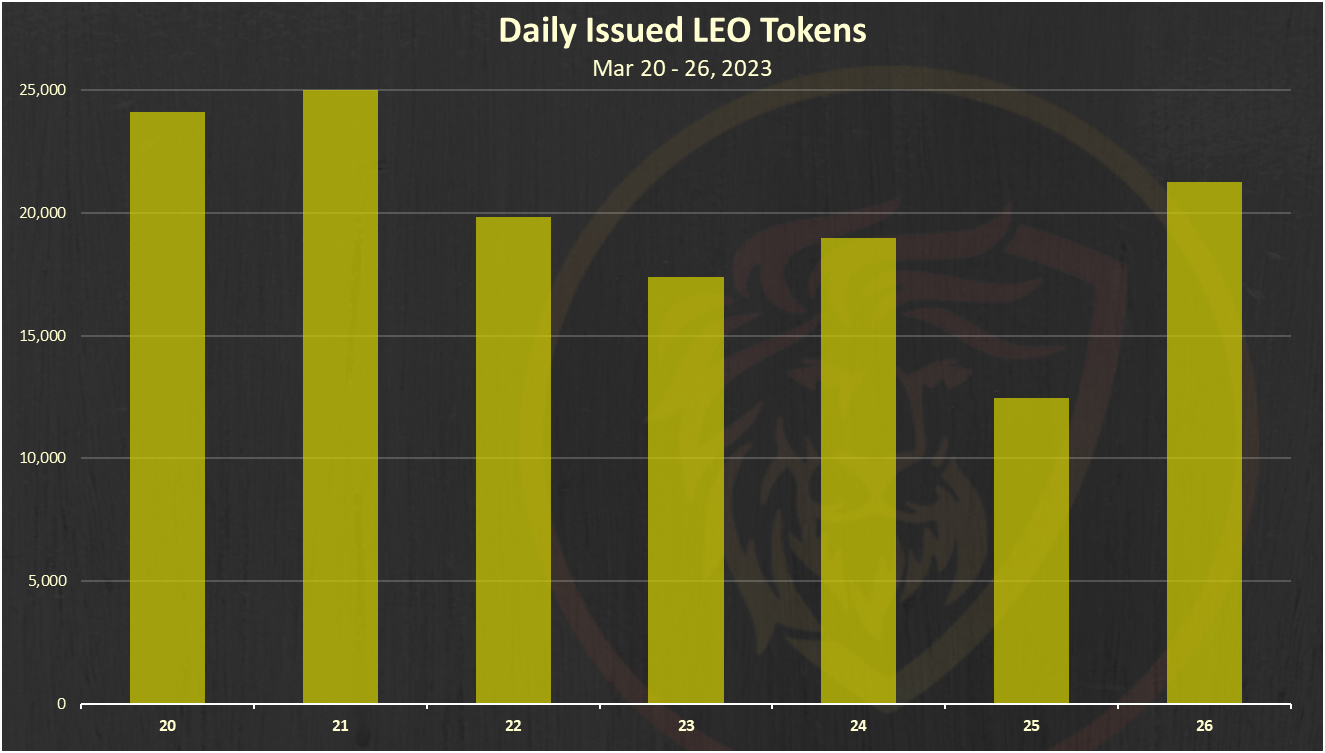
A total of 140k LEO were issued in the last week.
Let’s see how these tokens were distributed.
Below is the chart of the top 10 LEO earners this week.
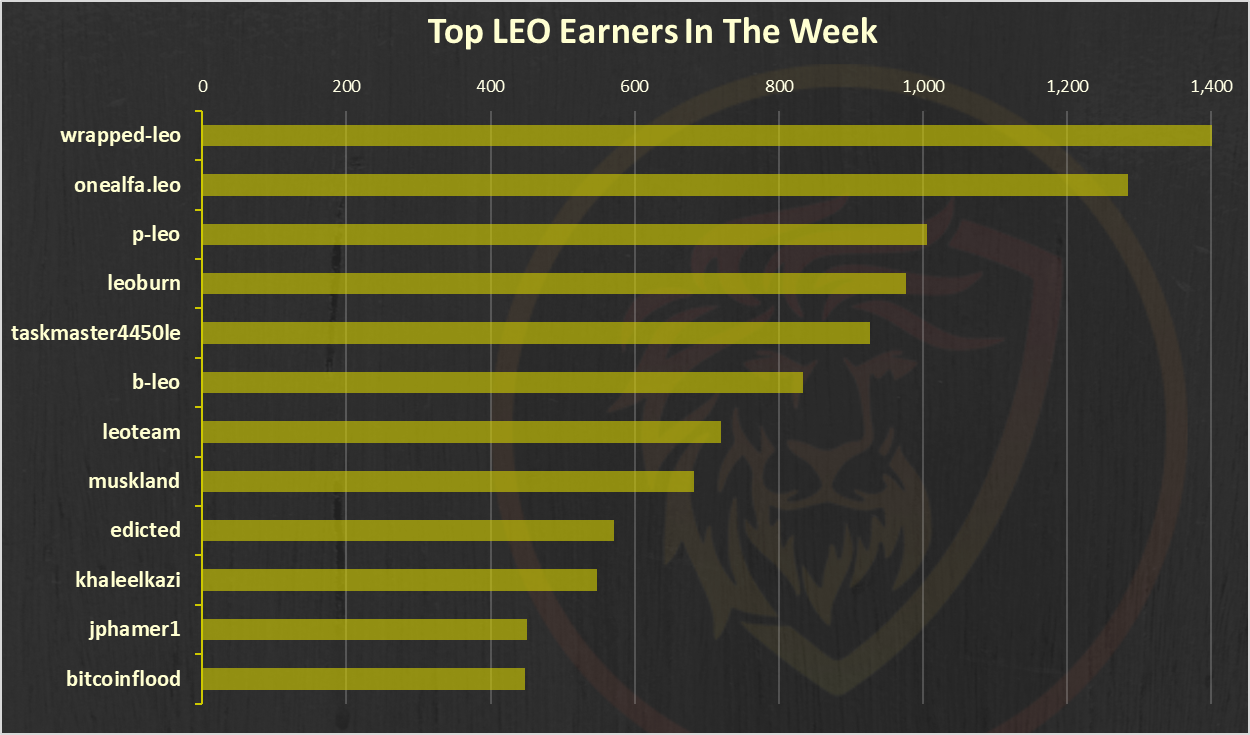
The @wrapped-leo account is on the top here.
Rewards from Bounties
Users who delegate their HP to the @leo.voter receive daily payouts in the form of LEO tokens at a rate of 16% APR. Also, at time some other bounties are in place.
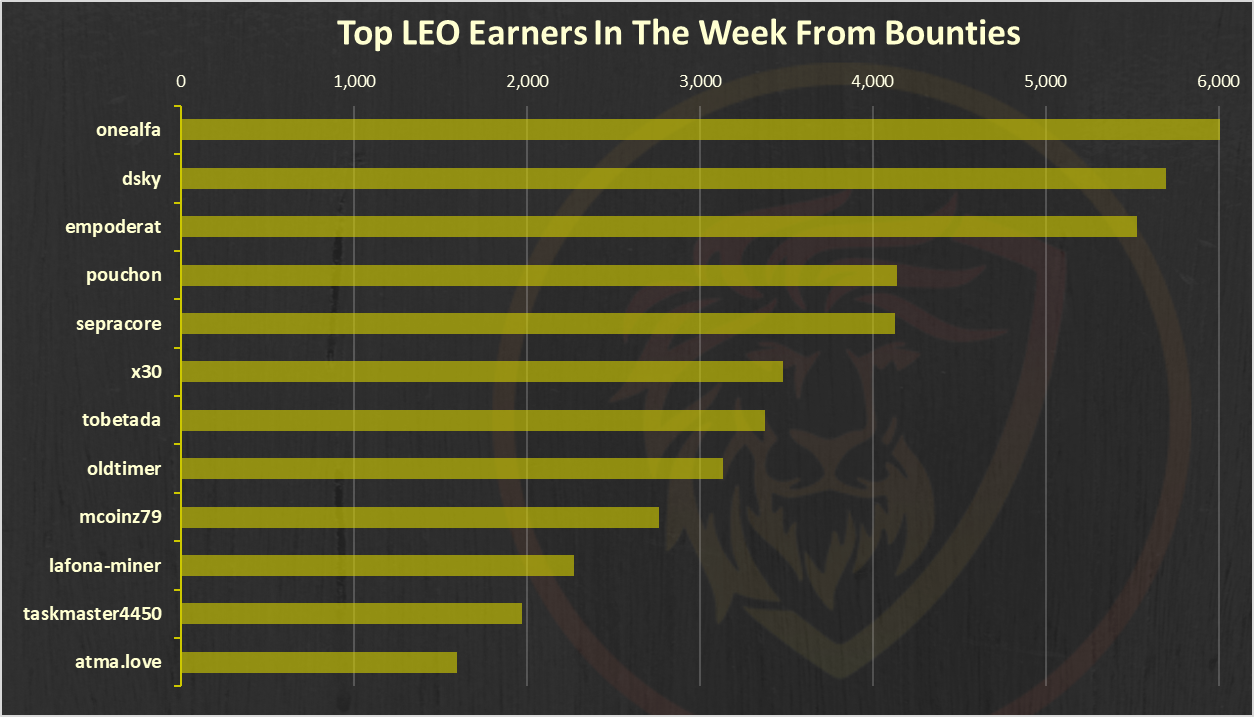
@onealfa is on the top here.
Staking LEO
Below is a chart that represents the monthly flow of staked and unstaked LEO tokens. A positive bar going up shows a day where more LEO was staked than unstaked.
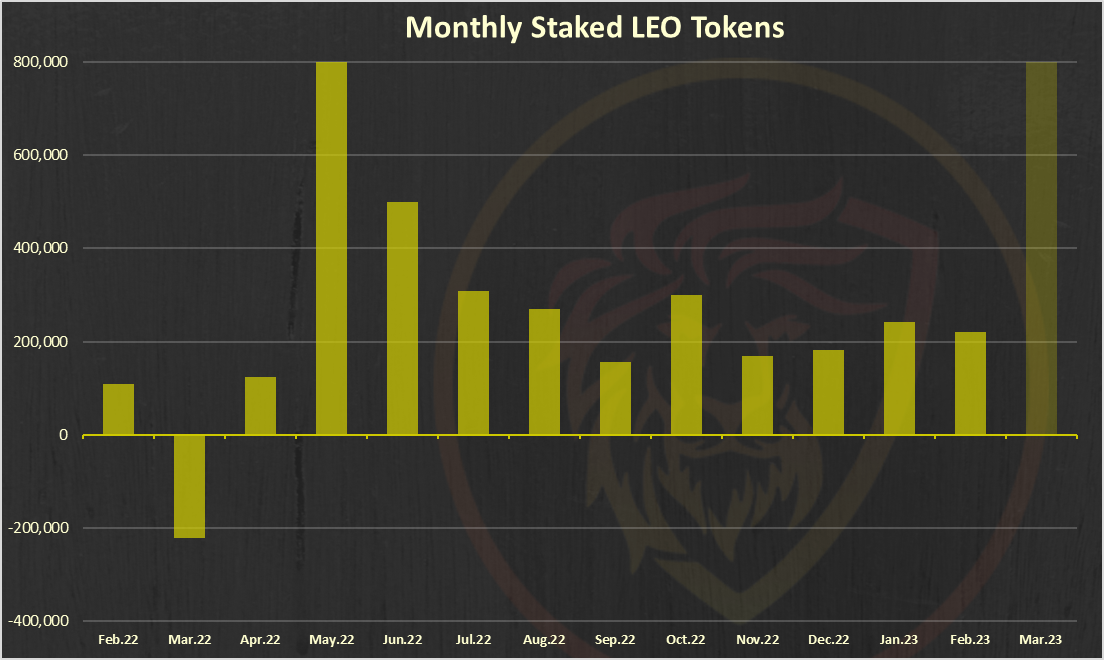
March is not over yet, but there is a significant increase in the amount of staked LEO. Up to 800k for now.
Below is the chart of the top 10 users that staked LEO last week:
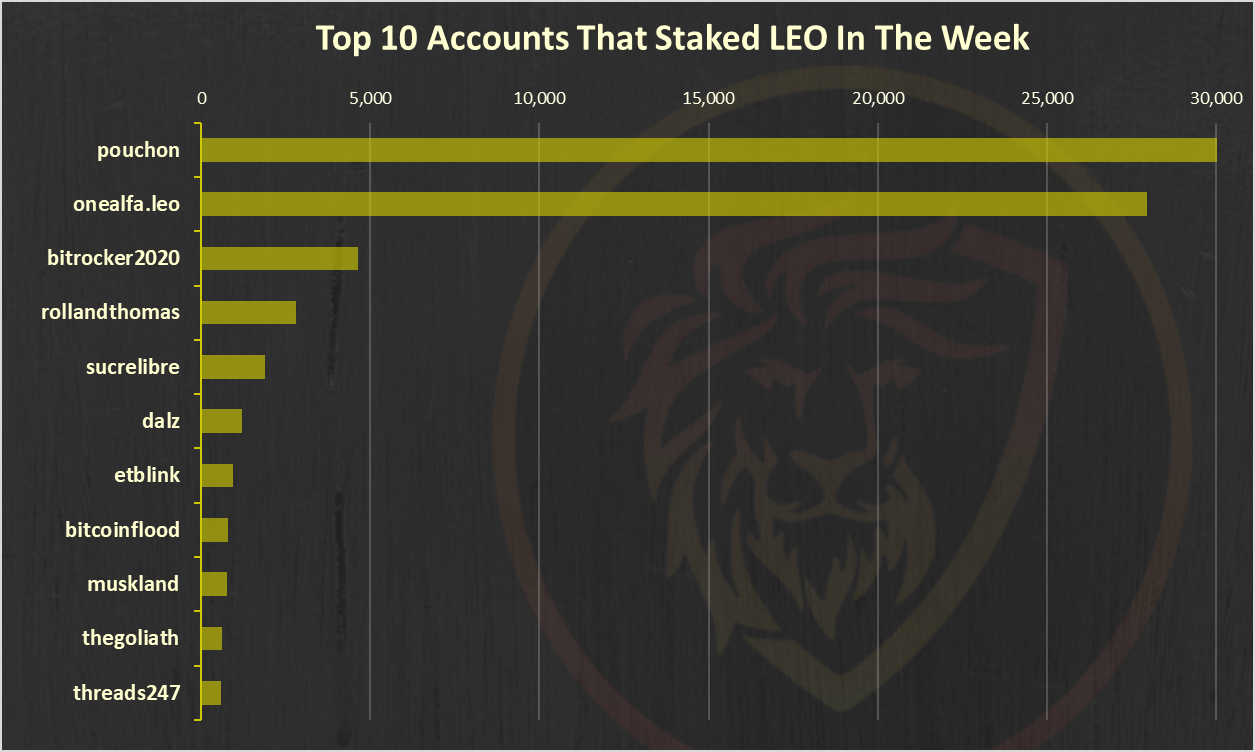
@pouchonis on the top here.
Liquid VS Staked:
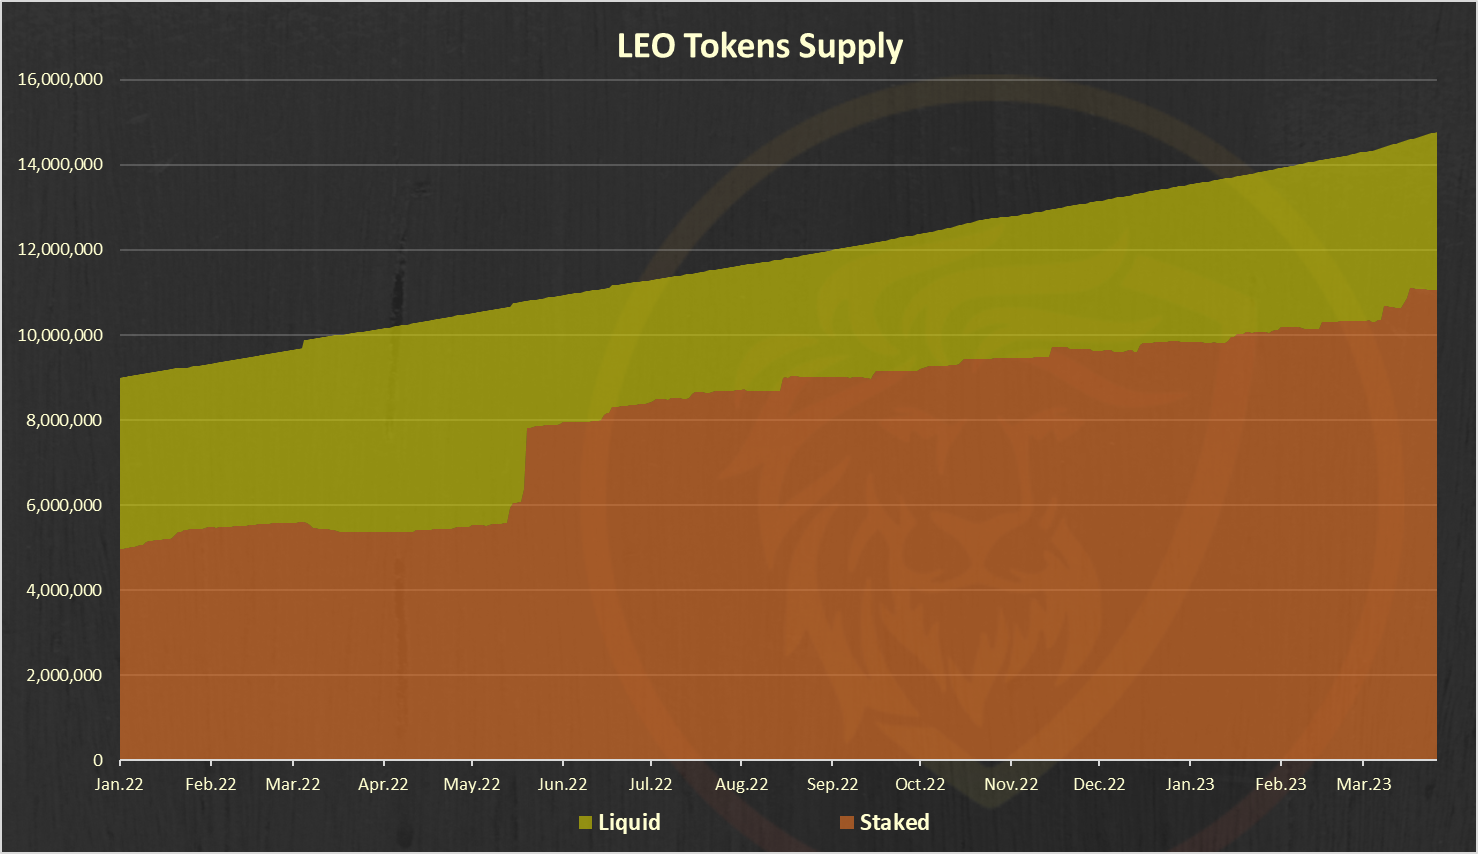
Note on the yellow, liquid category above. It includes the LEO in the liquidity pools on ETH and BSC as well. If we remove that, the liquidity will be much lower.
Below is a chart of the LEO tokens allocation.
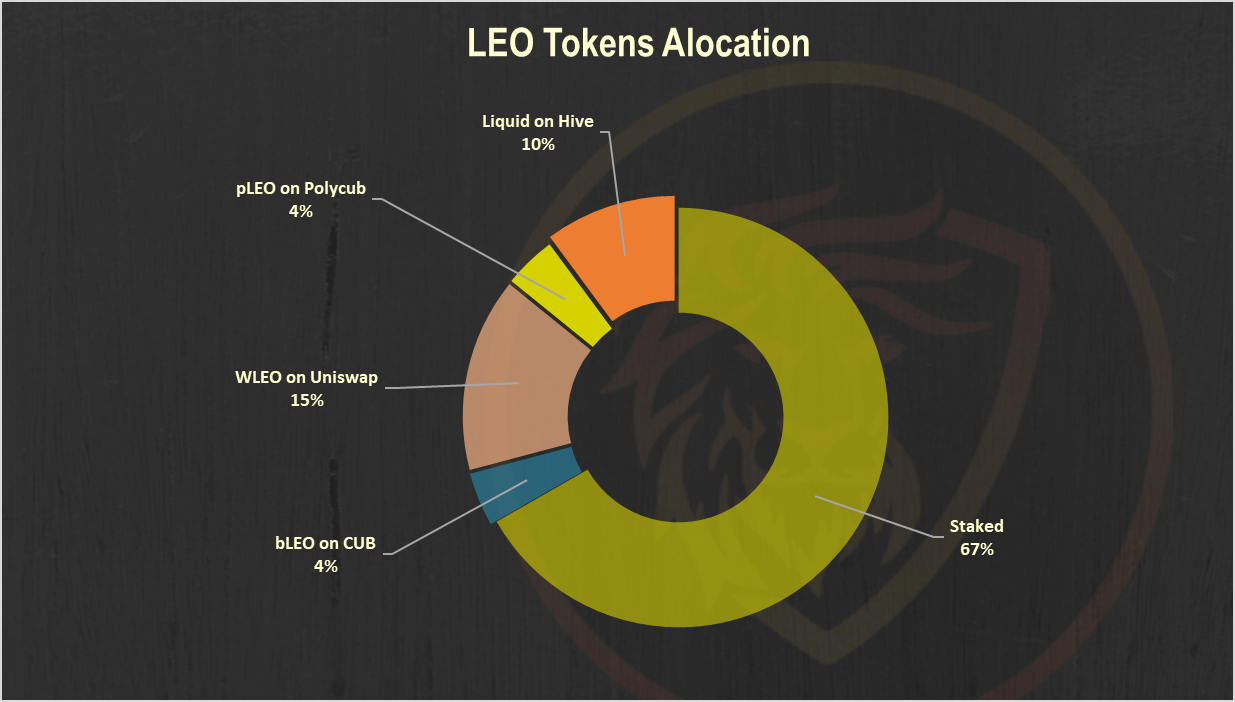
A 67% share staked.
LeoFinance Users
Below is a chart with the number of unique users that posted from the LeoFinance frontend.
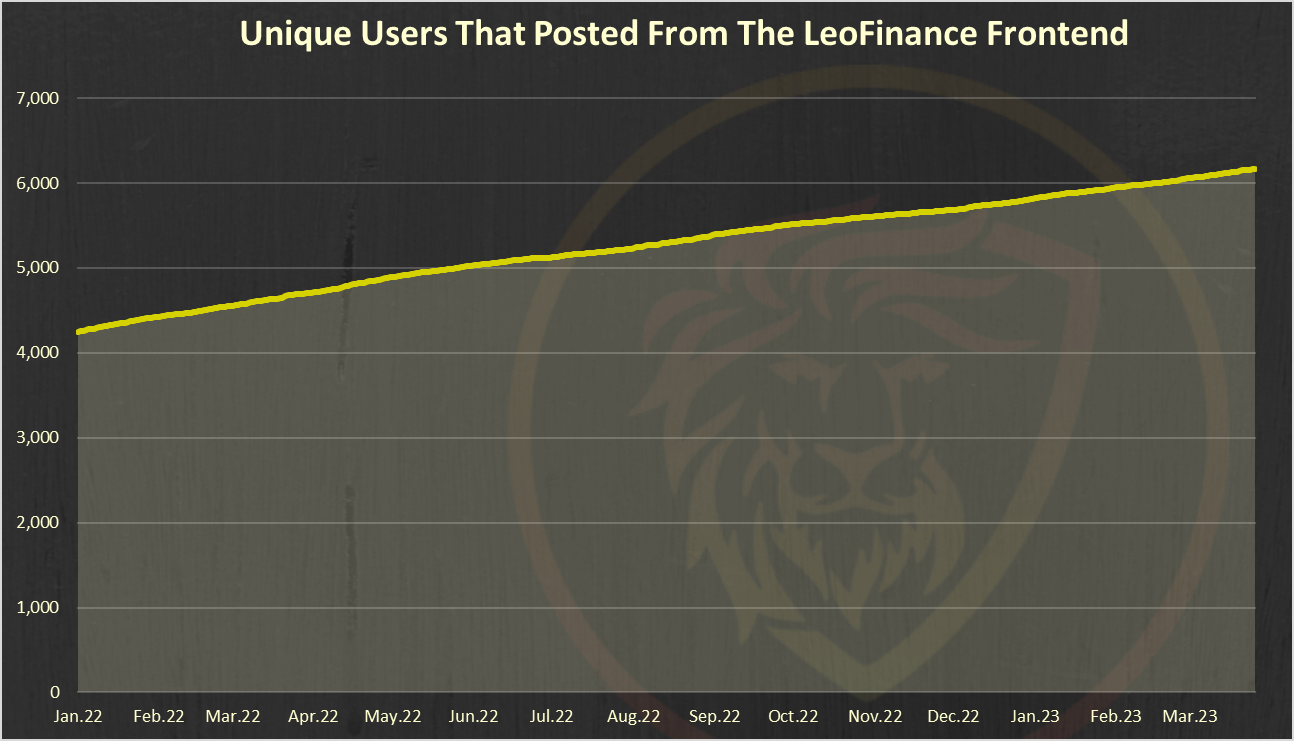
A 6.1k unique accounts have posted from the LeoFinance interface. This is the legacy UI, the new UI is still not included.
Monthly Active Users Posting and Commenting from LeoFInance [MAU]
Here is the chart for the monthly active users combined from the legacy UI leofinance.io and the new threads UI.
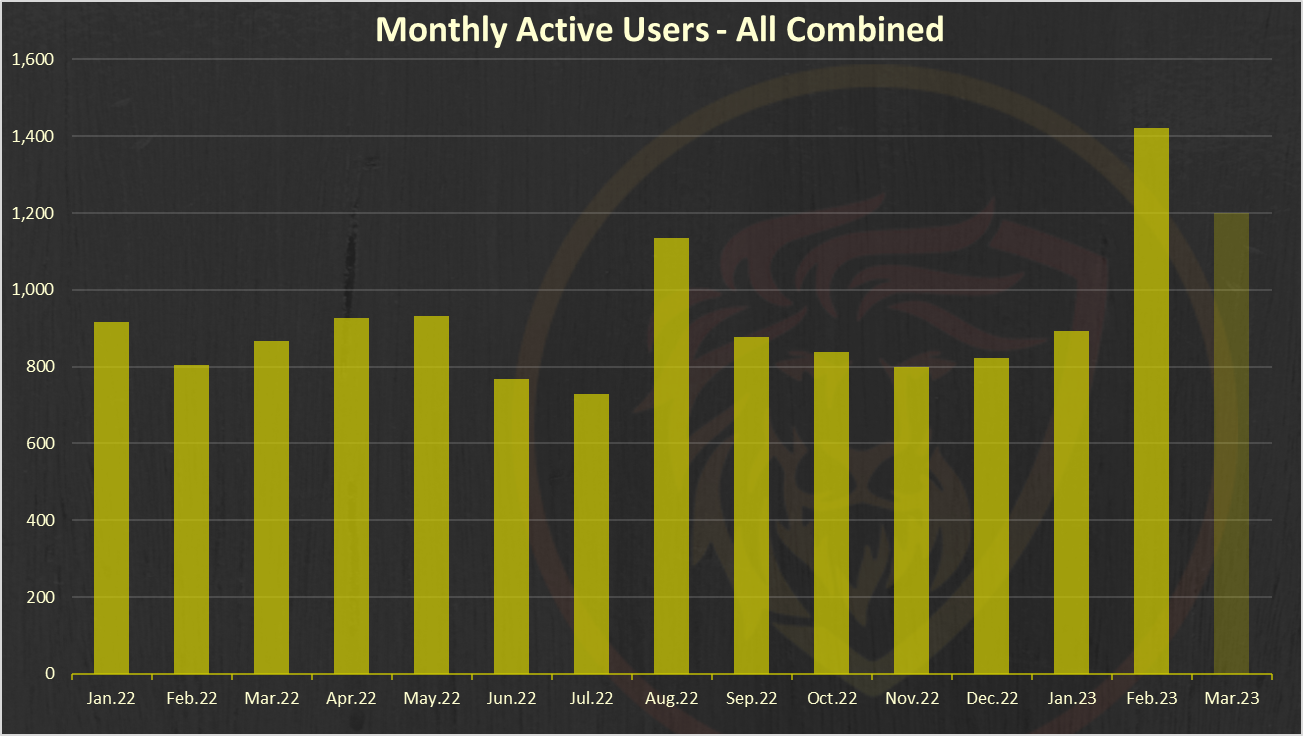
March is not over yet, but we will most likely have a small pullback in the number of active accounts. February had 1400 MAUS, combined from leofinance.io and the threads UI, while March will most likely be a bit lower.
Threads MAUs
What about threads only? How are the numbers doing here? Here is the chart.
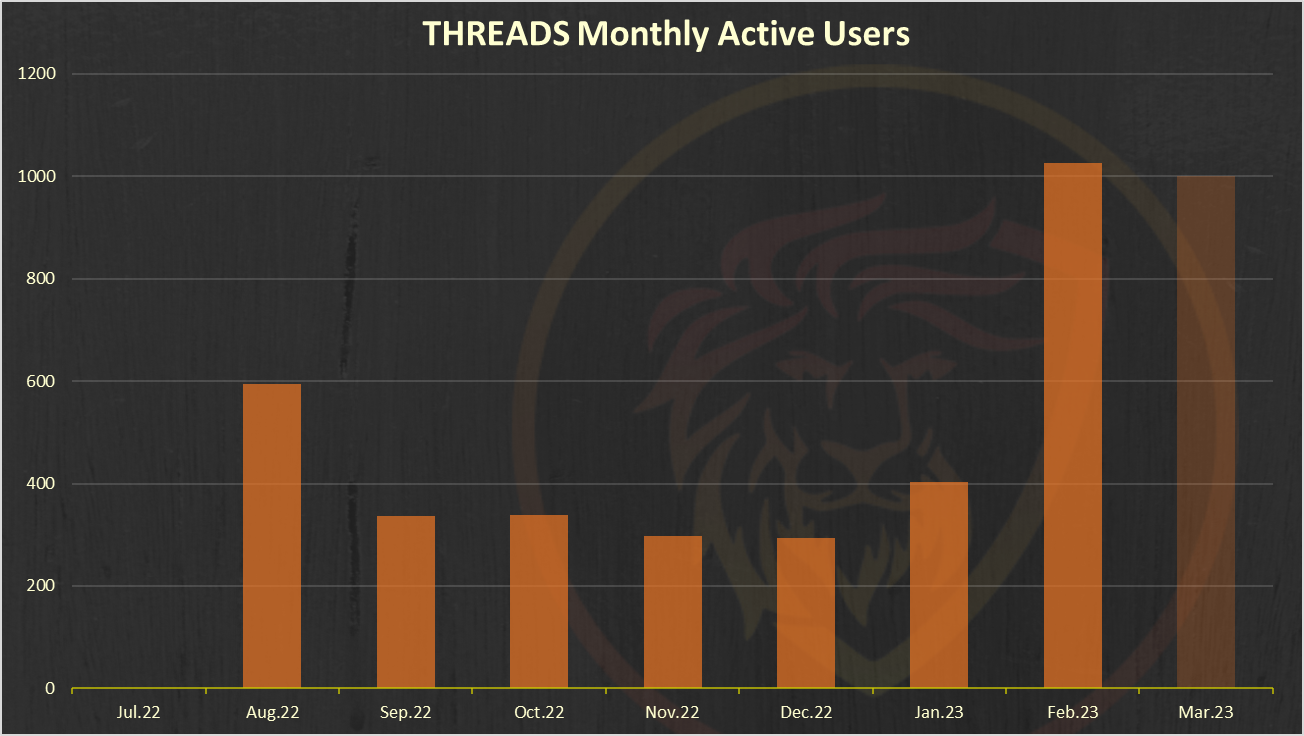
The first version of threads was launched back in August 2022, and there were around 600 MAUs. This number dropped in the months that followed, but then increased again to a new ATH in February 2023 with the release of the threads UI.
March seems on track to have around the same number if MAUs, as February with around 1k active accounts.
Posts, Comments and Threads
Here is the chart.
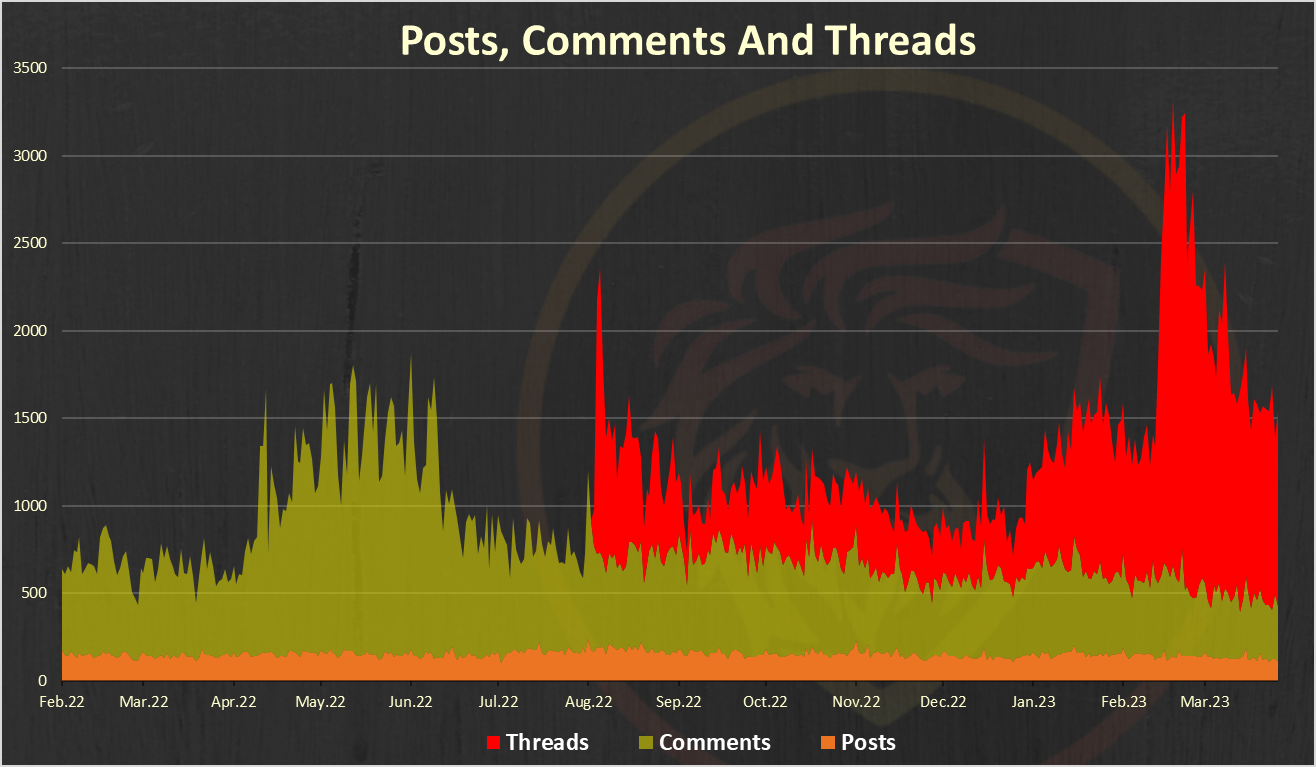
In summary last week’s looks like this:
- 880 posts
- 2.3k comments
- 7.7k threads
The number of threads has been on average around 1100 per day.Top Threads Creators
Here is the chart.
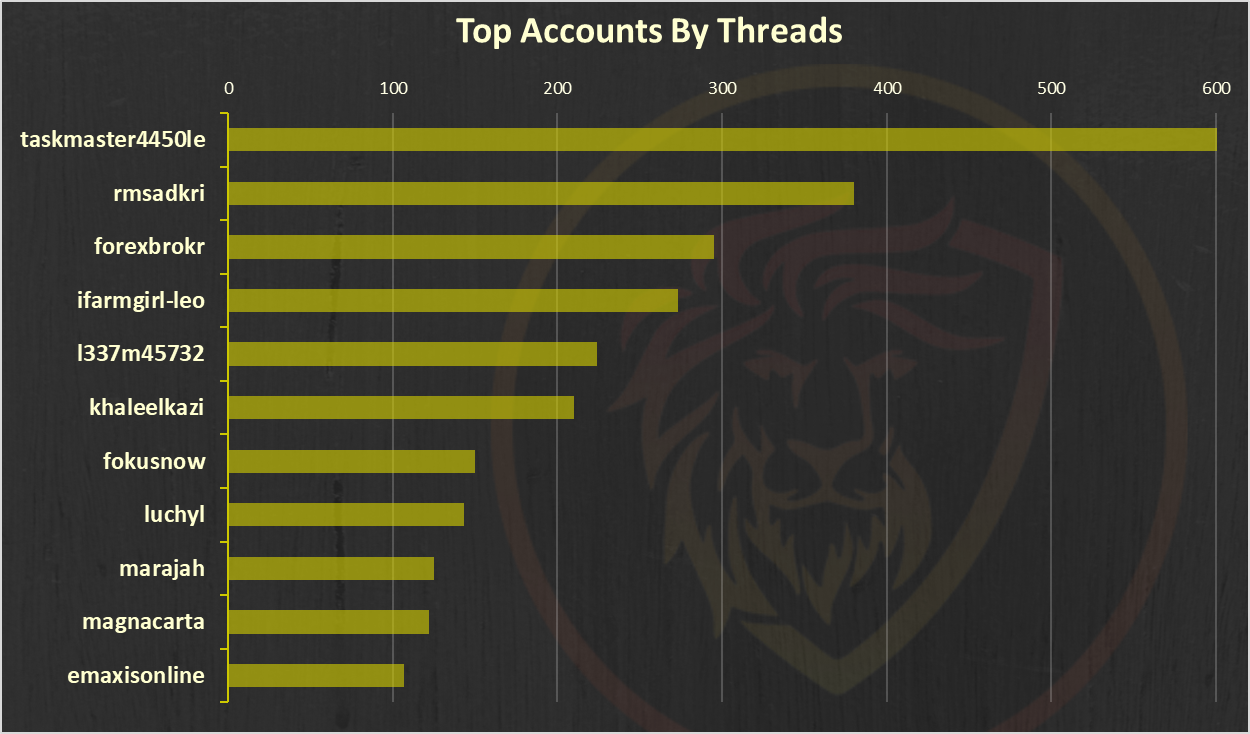
@taskmaster4450le is on the top followed by @rmsadkri and @forexbrokr.
Price
Here is the price chart in dollar value with average price.
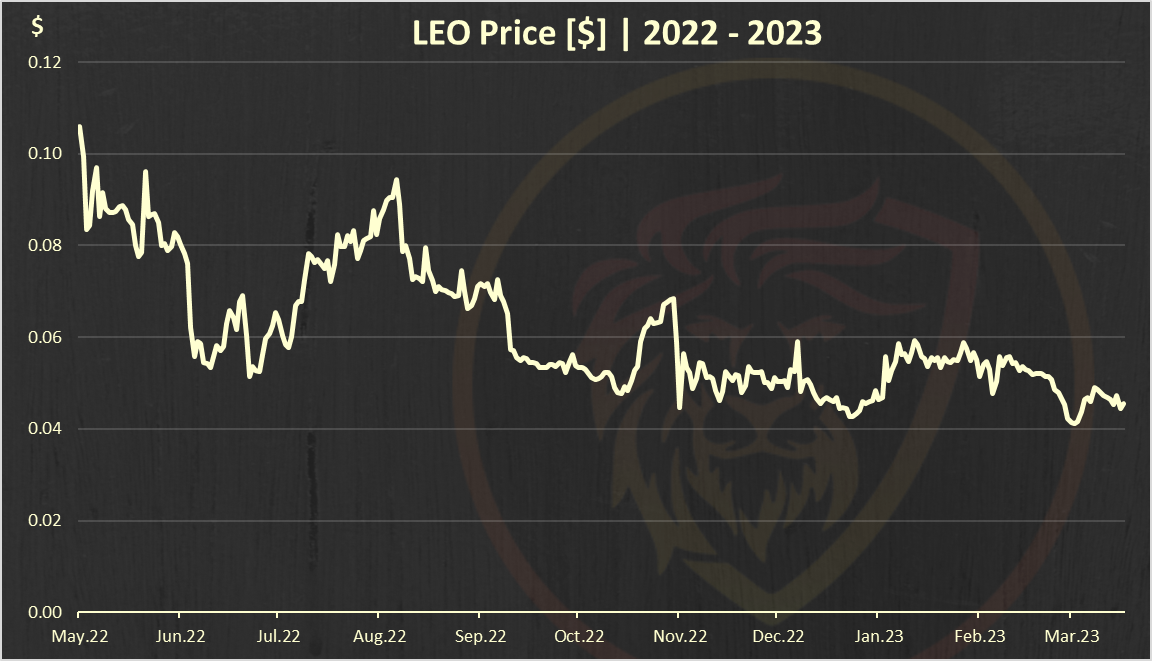
LEO is hovering around 5 cents.

Track Hive Data New Interface! About Us Hivestats LeoFinance Beta Learn More 


Trade Hive Tokens Wrapped LEO Hive Witness LeoDex Trade on Uniswap Vote 


Report by @dalz
Posted Using LeoFinance Beta
Well, shit I guess Task beat me in # of Threads this week
Posted Using LeoFinance Beta
Rookie :)
Big numbers this week from @taskmaster4450le.
But can you back it up week after week after week? 😉
Also good to see @rmsadkri as consistent as ever!
Posted Using LeoFinance Beta
Nice gains in active users.
Posted Using LeoFinance Beta
I don't know much about leo but I'm just following till I understand
Posted Using LeoFinance Beta
Man that is an incredible feat by Taskmaster. I just deleted my Twitter accounts after being banned from DMing anyone without giving Twitter my phone number, so I will be re-focusing my energy to Threading as often as possible instead.
Posted Using LeoFinance Beta
https://leofinance.io/threads/@mercadomaestro/re-leothreads-31vtvtzz5
The rewards earned on this comment will go directly to the people ( mercadomaestro ) sharing the post on LeoThreads,LikeTu,dBuzz.