Surfing The Market #11
What market phase are we entering into has been the introductory question for our last appointments.
Welcome to Surfing the Market, we are already at our 11th appointment and I hope that with these easy tech analysis we have helped you and we can help you further.
Let’s start from our usual weekly perspective
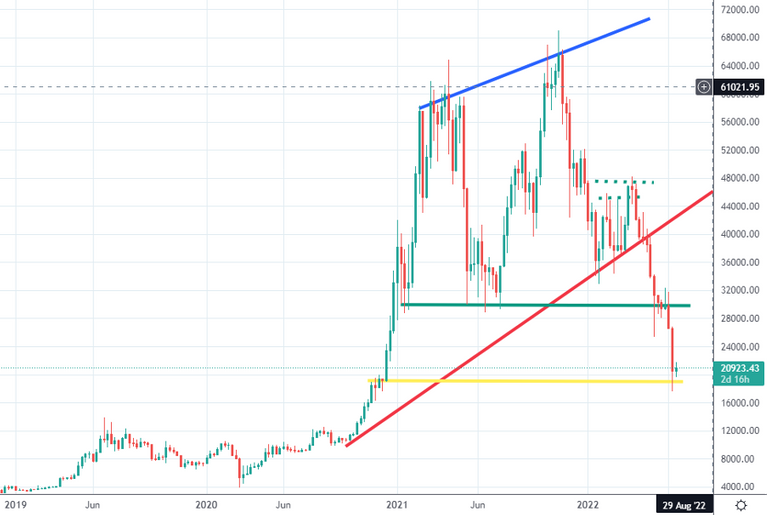
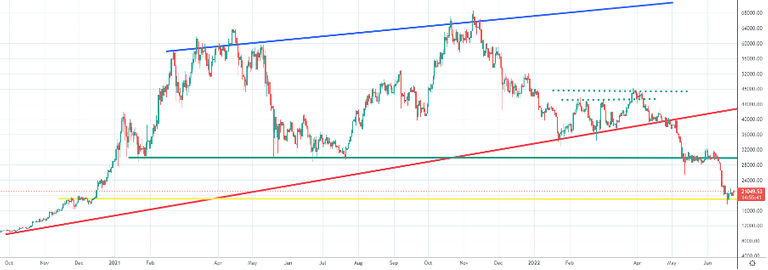
Weekly Chart
The last week has been a consolidation phase of the price level represented by the yellow line.
This moment is nice to create some accumulation of our BTC reserves, without taking too much risks, like I did just yesterday. That the Order History from my Binance account
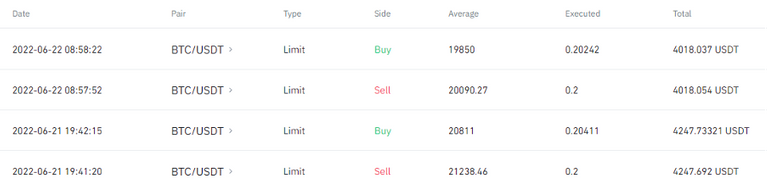
With a couple of small operations (executed in a few hours each) I accumulated 0.0063 BTC. That’s something more than 120 dollars. Last week 3 thousandth of Bitcoin and now 6. That to show my efforts to keep accumulating and accumulating BTC, since this type of accumulation does not require brand new money but just some risk instead. I trade risk for Bitcoin.
Besides, these new operations have been carried out with the support of a new trading indicator I am developing with the help of my team. If you want more information about it, drop a comment here and let’s evaluate how to spread it.
What do I expect from a daily perspective?
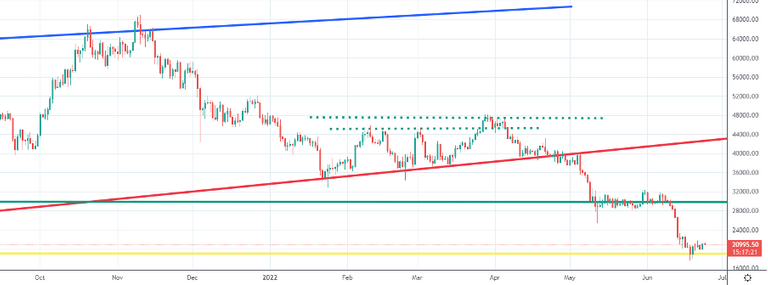
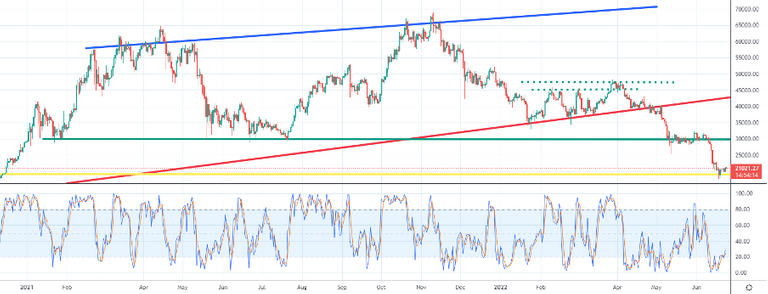
Daily Chart
Here is a daily chart, where the usual continuous red and blue lines are still clearly visible.
Price has bounced on the yellow line meaning that there is a liquid area, where the offer has been absorbed by demand.
Daily Chart
The yellow support line goes back to price levels, where a structure of consolidation was built back into October 2020 and this is the last “structured” price area. Below this price, we can go down towards 15.000$.
Daily Chart
Stochastic is in the oversold area and as said the last week, we saw a small bounce back. Anyway, this is physical, but I would rather wait for confirmation at price levels higher than 23000$, where price knocked in the last week and then 28000$, where price has bounced from 11th May to 11th June. Those levels are my key areas to check deeper if this bounce has been a dead cat bounce or a realistic reaction of the demand.
Ichimoku are still not helping us since they are too far from the price.
What to observe particularly?
We have seen the bounce back to 21000$ and I am now looking to pass this day, where a lot of BTC options will expire and I expect some volatility later today.
We are in a crucial area. But when everyone is fearful, I always buy. And that exactly what I am doing now.
Let me know what you think about this new weekly appointment, and what indicators you would like to be taken into consideration more (or even explained).
Stay tuned and be sure to follow to get noticed when my contents come out.
Yay! 🤗
Your content has been boosted with Ecency Points, by @mikezillo.
Use Ecency daily to boost your growth on platform!
Support Ecency
Vote for new Proposal
Delegate HP and earn more
Congratulations @mikezillo! You have completed the following achievement on the Hive blockchain and have been rewarded with new badge(s):
Your next target is to reach 800 replies.
You can view your badges on your board and compare yourself to others in the Ranking
If you no longer want to receive notifications, reply to this comment with the word
STOP