Bitcoin overview: Chart | Cost of Production | Interest rates
Fear is among us.
Expectations are growing that the FED will hike interest rates by a whopping 3 percentage points this year. What does that mean for Bitcoin? It means that credit is more expensive and leveraging becomes riskier.
Although I think Bitcoin has the best intrinsic properties to serve as money, we have to acknowledge that it's also a high-risk speculative asset. Whales buy on credit to sell for profit while liquidating everyone else on the process. In a situation of hiking interest rates people tend to seek protection on the bonds market, this way, crashing risk assets (stock market included). It doesn't mean, however, that Bitcoin will continue crashing as the FED acts.
“The price of any commodity tends to gravitate toward the production cost. If the price is below cost, then production slows down. If the price is above cost, profit can be made by generating and selling more. At the same time, the increased production would increase the difficulty, pushing the cost of generating towards the price.” — Satoshi Nakamoto
Most people don't factor in an important aspect of Bitcoin: cost of production. Without debating POS vs. POW, we can safely say that the market rules cannot be manipulated. According to estimates, the production cost of one Bitcoin is aprox. $32,000, meaning that some miners are either 1. operating on red or 2. selling their stock. One way to check the later is by inspecting Bitcoin's Miner Rolling Inventory (MRI) indicator, which, unfortunately, I don't have access to.
With that said, at $29,000, Bitcoin is short of its production cost and a sustained price below target should reflect in a decrease in mining difficulty or more capitulation.
The chart
Bitcoin performed a nasty bull-trap on my previous chart analysis. I said that a failed attempt to support above 43k meant more blood; I never expected the fall to be so sharp though. I also pointed out that ascending triangles meant reversal of a bear trend or a continuation. Bellow we can see that it was a continuation.
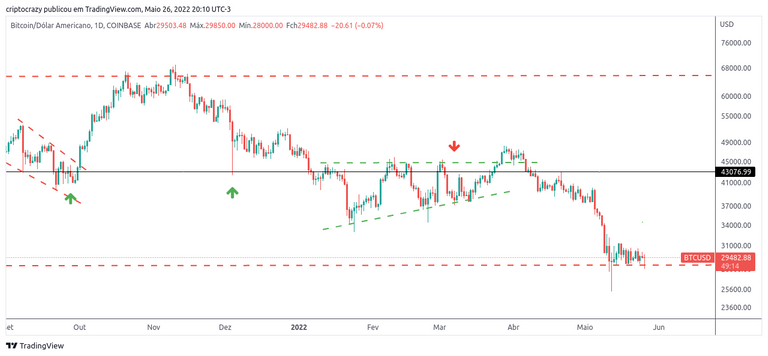
I'm expecting a rally from here, although the markets seem quiet, reluctant, in fear, and expecting a recession. In terms of patterns, I don't see anything meaningful on the daily.
On the other hand, the weekly chart seems more interesting.
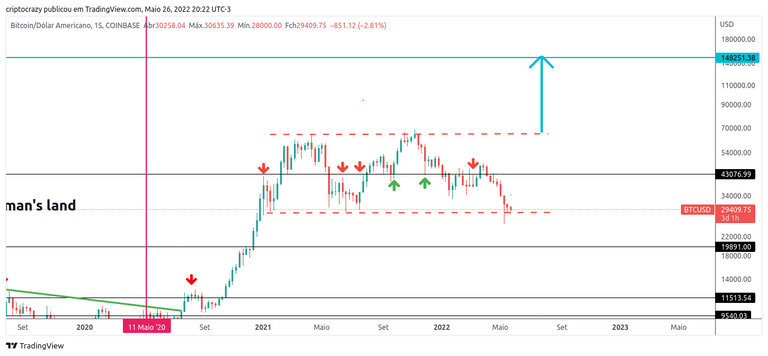
Bitcoin has touched the bottom of the rectangle. A huge wick two weeks ago indicates market interest in those prices, but also means a heck ton of stop-losses might be placed just below the rectangle. Are the whales going to push the price further down? I don't know.
Weekly RSI is on the lower band. Past performance shows us that weekly RSI rarely stays so suppressed, as seen on the chart below.
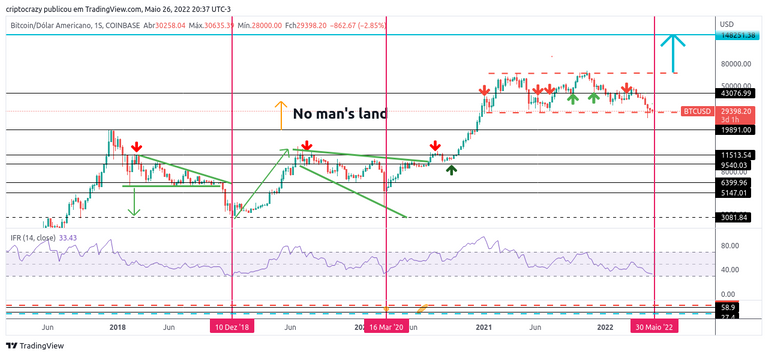
In sum, I expect a rally and consider this dip a generous buying opportunity for those dollar cost averaging. Those do hodl shall be rewarded in the future.
Let's see what the upcoming weeks reveal.
Peace.
Posted Using LeoFinance Beta
Congratulations @mrprofessordaily! You have completed the following achievement on the Hive blockchain and have been rewarded with new badge(s):
Your next target is to reach 500 comments.
You can view your badges on your board and compare yourself to others in the Ranking
If you no longer want to receive notifications, reply to this comment with the word
STOPCheck out the last post from @hivebuzz:
Support the HiveBuzz project. Vote for our proposal!