09-04-2024 - Economy - revenue maximization [EN]-[IT]
~~~ La versione in italiano inizia subito dopo la versione in inglese ~~~
ENGLISH
09-04-2024 - Economy - revenue maximization [EN]-[IT]
maximization
To obtain results the company can act on price, quantity or both.
Example:
A company may decide to lower the price to increase revenue.
In the business sector the term marketing mix is known. This term indicates the various marketing combinations that companies implement to achieve their objectives.
The demand curve has an elasticity, depending on the price the demand changes little or a lot.
If we think of a graph of price elasticity, we will have that in the central part of the demand and average revenue curve edp (price elasticity) is equal to 1.
In the upper part edp>1
In the lower part edp<1
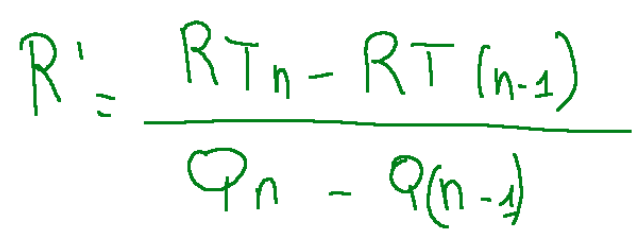
When price elasticity is equal to 1 (edp=1) marginal revenue is equal to zero (R'=0)
Below is the marginal revenue formula (R')
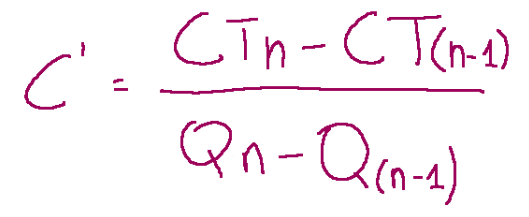
By analogy the marginal cost formula is the following (C')
Revenue Maximization Chart
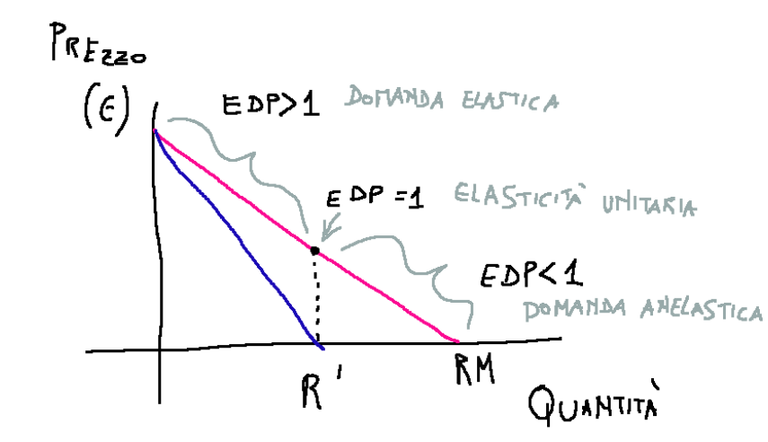
From this graph we can see that the marginal revenue curve (R') is more sloped than the RM curve (average revenue curve)
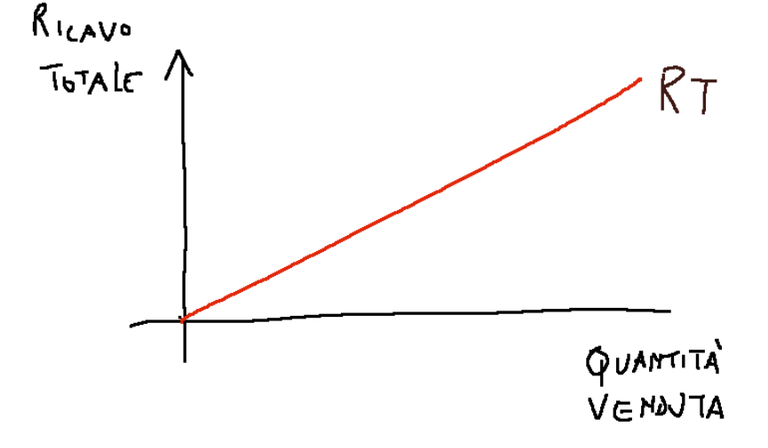
Perfect competition market
In this type of market the total revenue (RT) increases proportionally as the quantity increases
Conclusions
For businesses that produce goods, setting the right selling price is the basis for success.
Request
Have you ever heard of profit maximization? Maybe you have heard about this topic in the company where you work, if you work for a private company.
![]()
ITALIAN
09-04-2024 - Economia - massimizzazione del ricavo [EN]-[IT]
massimizzazione
Per ottenere dei risultati l’impresa può agire sul prezzo, sulla quantità oppure su entrambi.
Esempio:
Un'impresa può decidere di abbassare il prezzo per aumentare i ricavi.
Nel settore delle imprese è noto il termine marketing mix. Con questo termine si indicano le varie combinazioni di marketing che le imprese mettono in atto per raggiungere i propri obiettivi.
La curva di domanda ha un’elasticità, a seconda del prezzo la domanda cambia di poco oppure di molto.
Se pensiamo ad un grafico dell’elasticità del prezzo, avremo che nella parte centrale della curva di domanda e del ricavo medio edp (elasticità del prezzo) è uguale a 1.
Nella parte alta edp>1
Nella parte bassa edp<1
Quando l’elasticità del prezzo è uguale a 1 (edp=1) il ricavo marginale è uguale a zero (R’=0)
Qui di seguito la formula del ricavo marginale (R’)
Per analogia la formula del costo marginale è la seguente (C’)
Grafico della massimizzazione del ricavo
Da questo grafico possiamo notare che la curva del ricavo marginale (R’) è più inclinata della curva RM (curva del ricavo medio)
Mercato concorrenza perfetta
In questa tipologia di mercato il ricavo totale (RT) aumenta in modo proporzionale all’aumentare della quantità
Conclusioni
Per le imprese che producono beni, fissare il prezzo giusto di vendita è la base per avere successo.
Domanda
Avete mai sentito parlare della massimizzazione del profitto? Magari avete sentito parlare di questo argomento nell'azienda in cui lavorate, se lavorate per un impresa privata.
THE END
The good thing is that a company determines the price but the competition they’ve got with other companies is what will make them put the price in the range it should be…
You understood perfectly the meaning of the free market, or these are things you already knew. Exchanging opinions with you is always a pleasure. In this article I try to describe the concept of revenue maximization which is basically a simple concept. Maximum profit is achieved when total cost and total revenue are at their maximum distance. The other concept that I consider important is that when we are in a perfectly competitive market (example rice market) the total revenue increases proportionally as the quantity increases !LOLZ
lolztoken.com
I want someone who can set my world on fire!
Credit: reddit
@rafzat, I sent you an $LOLZ on behalf of stefano.massari
(1/6)
ENTER @WIN.HIVE'S DAILY DRAW AND WIN HIVE!
I have reconstructed a graph below that can be used as an example. The curves represented are the red one the total revenue curve and the blue one the total cost curve. At the QMP point we have the profit maximization point. If instead we increase the quantity sold and go to QL, we see that for that quantity the total cost is greater than the total revenue. In this situation the company starts to make a loss.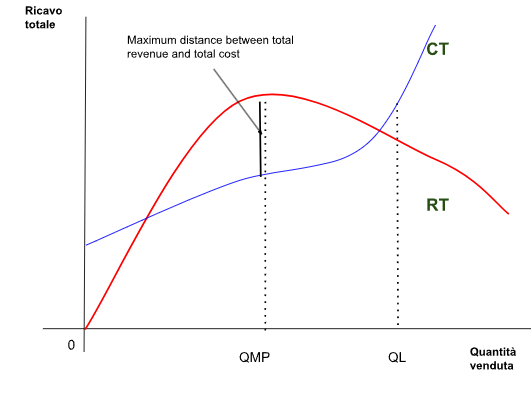
!CTP
Ovviamente , in azienda
Grazie per aver risposto Lu. Nelle aziende che hanno voglia di restare sul mercato si sente infatti parlare di massimizzazione del mercato.