Using Divergences of Relative Strength Index (RSI) by @taiwo-micheal
Cover Page Created on Canva
Hi everyone. It's another time again. I welcome you all to my post. Today, I am going to be sharing something very important with you. Crypto lovers and analysts will like this post. Happy reading.

Using Divergences of Relative Strength Index (RSI)
One of the popular indicators used to analyze or predict the direction of price by traders or analysts is relative strength index (RSI). Many traders use method of technical analysis to analyze the market because all they need is on the chart.
RSI is popular because of its usefulness in technical analysis. It's very easy to read, gives high percentage of success rate and simple to understand. Perhaps that's what makes it popular.
The indicator was developed by a popular technical analysts, J. Welles Wilder Jr*. He developed the indicator in 1978. The man was popular because of his work in technical analysis. RSI is a momentum-based indicator which shows when the price is overbought and oversold.
It has a single line which oscillates up and down the indicator window. It's scaled from 0 to 100. The scale of 0-30 is known as oversold region. The scale of 70-100 is known as overbought region.
When the RSI line crosses the scale of 30 and go below, that signifies that the price is oversold and it means that the sellers are getting weak and that they may be taken out of the market by sellers. In this region, the sellers take profit from the market because they know the buyers may step in very soon. In essence, the zone or region is known as buy signal.
On the other hand, when the RSI line crosses 70 and above, it shows that the price is overbought.This often signifies that the buyers are weak and the sellers may take hold of the price very soon. Therefore, buyers take profit from the market and exit the market at this zone. In essence, this region is often regarded as sell signal.
Adding RSI to the Chart
Let's see how to add the indicator to the chart. I'm going to be using MT4 App to do this.
Step 1
To add RSI to the chart, locate your MT4 on your mobile phone. Then click on it. Select the cryptocurrency pair you want to add the chart to. Then click on the chart.
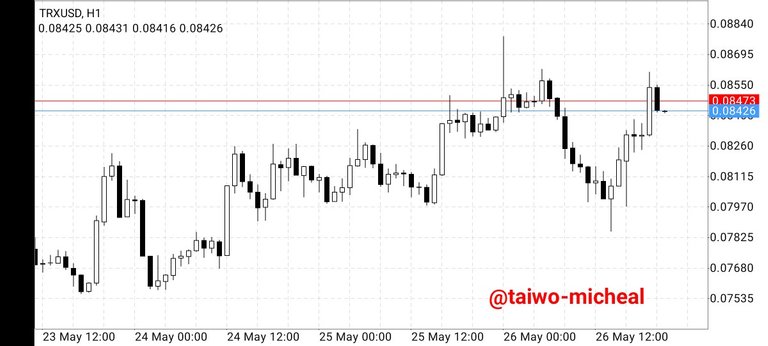
Image Taken from MT4 App
Step 2
Next is to tap the chart once. Upon tapping it, some features or icon will appear. Locate the "f" icon at the right hand side and click on it.
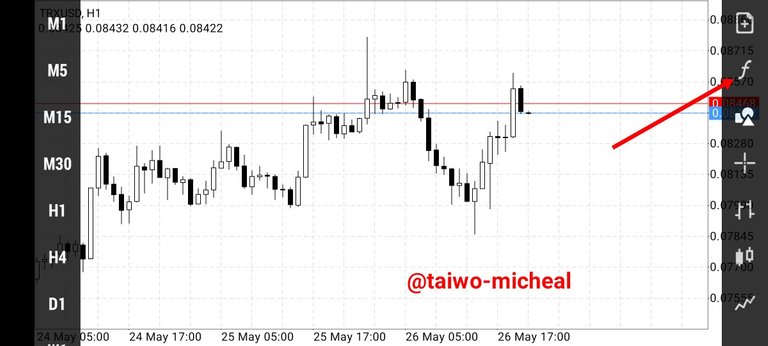
Image Taken from MT4 App
Step 3
Upon clicking on the "f" icon, you will see some categories of of the indicators. Locate the relative strength index under oscillator and click on it.
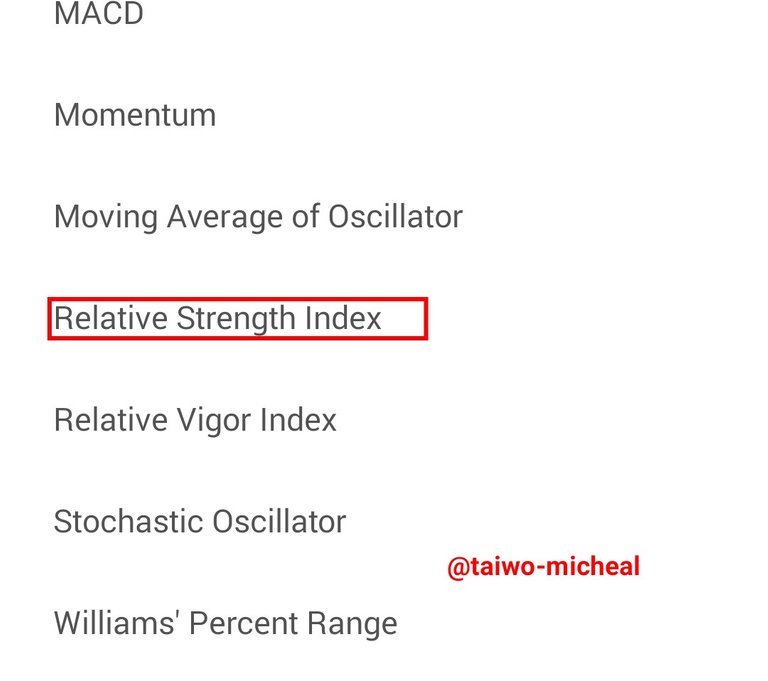
Image Taken from MT4 App
Step 4
Then, next you will see the details of the RSI being displayed. You can edit the settings of this indicator by setting it to whatever you like. But for this tutorial, we will use the default settings. So, leave everything as it's.
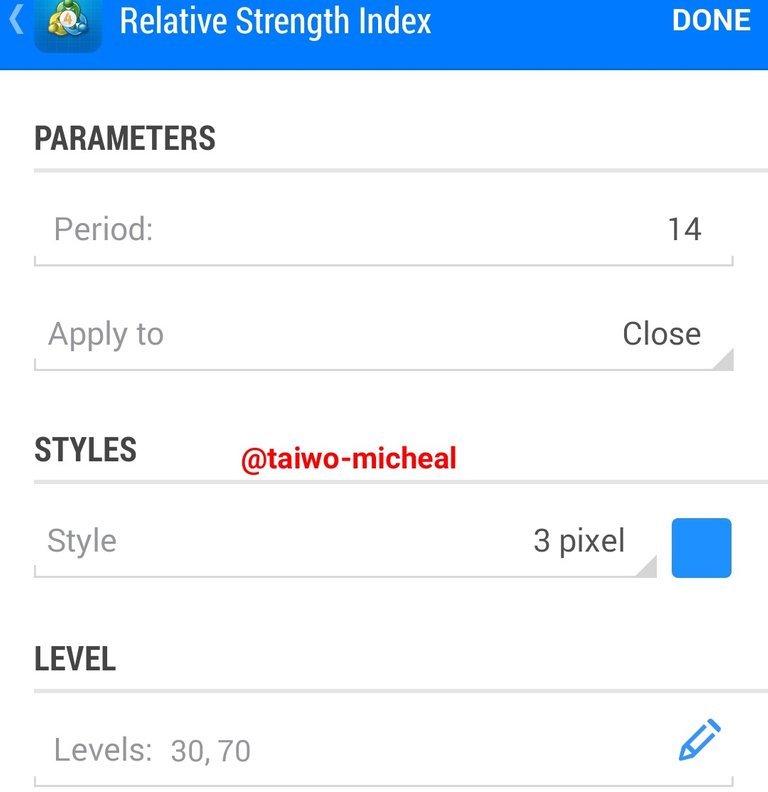
Image Taken from MT4 App
Step 5
Once everything is set, the next thing is to click on "done" as it's in the previous image in step 4. Then once you click on "done" , the indicator will be added to the chart. See the screenshot below.
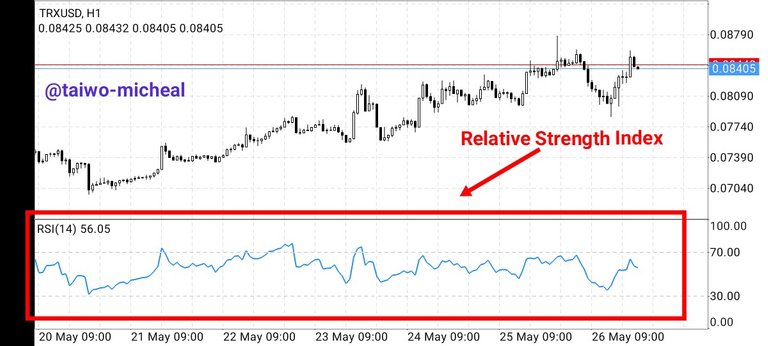
Image Taken from MT4 App
Now, that we have seen how to add RSI to the chart, let's see how to use the divergences with this indicator.
RSI Divergences
One of the best strategies which traders use with this indicator is divergences. There are two types or kinds of divergences: bullish divergence and bearish divergence
Bullish Divergence
Bullish divergence is a signal for long or buy. It's a divergence which occurs when the sellers are already getting weaker. Now how does this divergence forms?
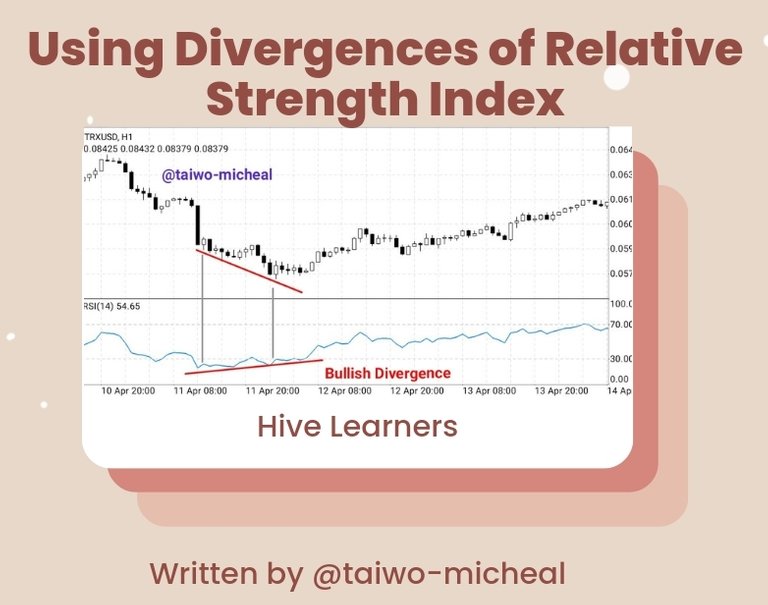
When price makes lower lows in a downtrend and RSI makes higher low, then a bullish divergence forms. Initially, RSI supposed to be moving as the price is moving, but when RSI goes against the direction of market structure, then we see divergence form. See the screenshot below.
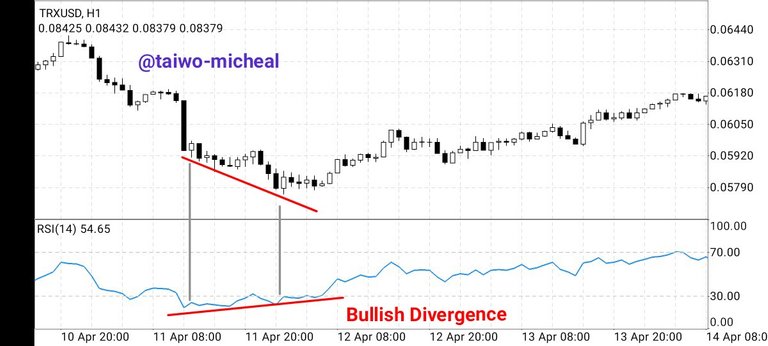
Image Taken from MT4 App
As you can see from that image above, price made lower low, but RSI made lower high. That's bullish divergence... And immediately it formed, price rallied to the upside.
Bearish Divergence
Bearish divergence is a signal to short the market and also a signal to take profit from a buy trade and exit the market. This divergence occurs when buyers are getting weak in the market and can't push the price up any longer.
This divergence forms when the price makes a higher high and RSI makes a lower high. Initially, if the structure is still intact, RSI supposed to be moving in the same direction of price. But when it goes against the higher high of the price, then it's a bearish divergence.
Let's see an example of a bearish divergence in a screenshot below.
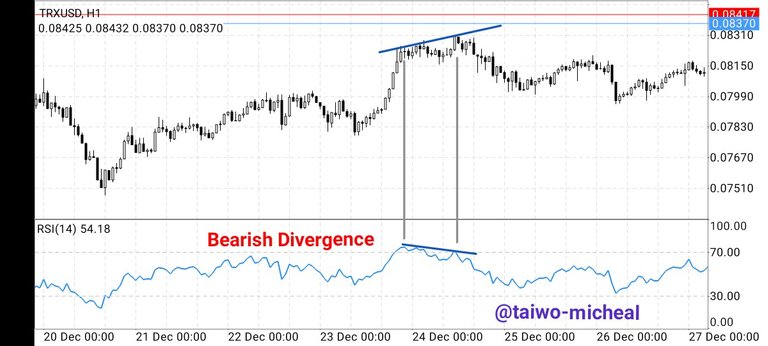
Image Taken from MT4 App
If you look at the screenshot attached above very well, you will notice that price made higher high and RSI made lower high. That's a signal that the price of that asset will fall... And you could see that it actually fell after that formation.
Conclusion
In this post, I have explained RSI divergences, bullish and bearish divergences. To increase the success rate of this strategy, some traders combine one or two more technical indicators with RSI. Perhaps I can create another post where I will show you some of the best indicators that can be combined with this indicator. But I do hope you enjoy this piece of mine today. Thank you for visiting my post.
Kind regards,
Congratulations @taiwo-micheal! You have completed the following achievement on the Hive blockchain and have been rewarded with new badge(s):
Your next target is to reach 50 comments.
You can view your badges on your board and compare yourself to others in the Ranking
If you no longer want to receive notifications, reply to this comment with the word
STOPTo support your work, I also upvoted your post!
Support the HiveBuzz project. Vote for our proposal!