EN/ESP - Bitcoin Analysis for April 12th
English
What's up investor friends?
We start the week analyzing BTC, which has remained in the area of $56K - $61K in recent days. BTC's insistence to break the all-time high is remarkable, but so far it has failed to do so.
There is too much fundamental news out there that is practically incentivizing BTC to continue its bullish path for a long time, but I think all of us traders know that a rise without its due corrections is not healthy.
1-day candles
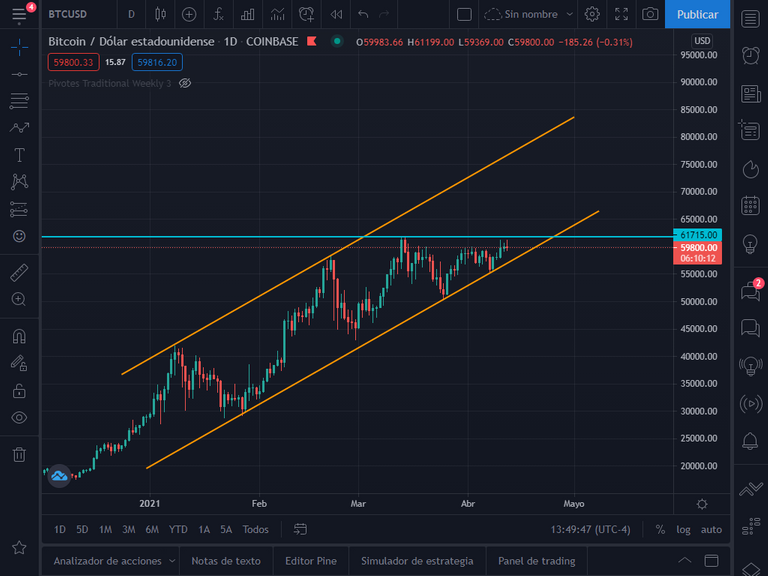
As we can see, BTC has been in a visible bullish channel on daily candles, it has respected it perfectly so far. However, we can observe a price weakness in the area of the historical high at $61700.
At the moment BTC is at a rather decisive point, as it is getting locked in between key resistance and the uptrend line of the channel. At this point there are only two options left, to overcome the resistance and continue its upward path, or to break the channel to the downside and correct to key areas.
1-day candles
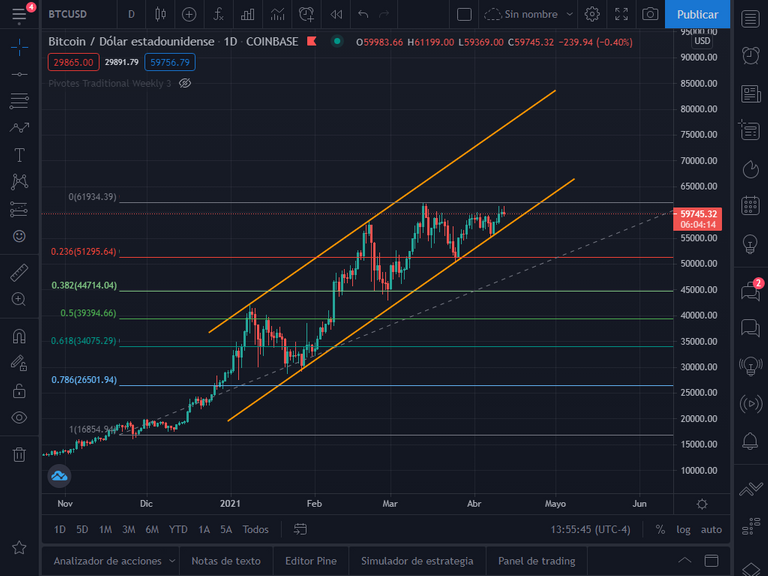
In the event of a breakout to the downside, we could see a price correction to the support levels at $45K and $40K, which just so happen to perfectly match the .38 and .5 Fibonacci. These are important and quite strong levels.
1-day candles
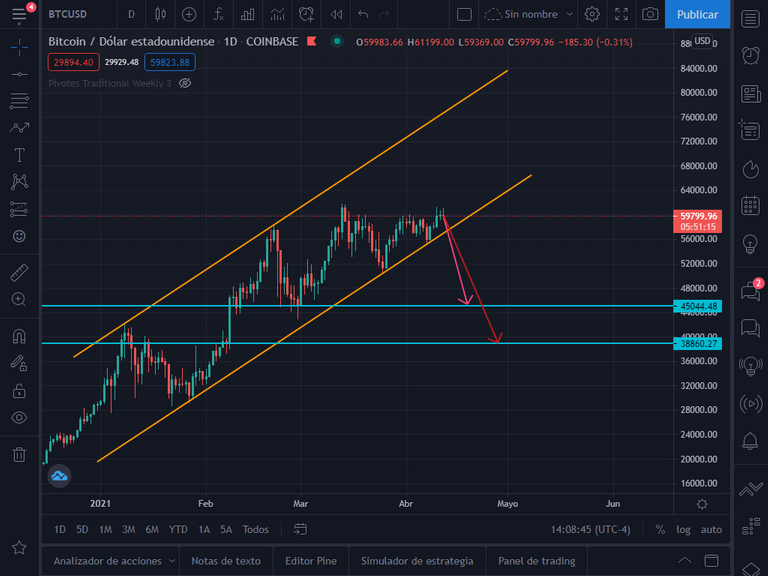
I think a correction to these points will be very healthy for BTC, plus it is an excellent entry point for hodlers. They would be taking one step back to take two steps forward.
Personally I am staying out of the market at this time. I am waiting for price action to see which way BTC goes in the short term. If it corrects, I will probably buy at the points I have indicated, and if it breaks to the upside convincingly, I will buy with targets at $70K probably and a stop below $58K.
I hope this information is helpful to you fellow traders. Best of odds to you 💪📈.
Disclaimer
The information given in this article is only my analysis and personal opinion. Be sure to do your own analysis and research. Trading cryptocurrencies, forex, commodities, etc, is risky.

Español
¿Qué tal amigos inversores?
Iniciamos la semana analizando al BTC, el cual se ha mantenido en la zona de los 56K$ - 61K$ en los últimos días. La insistencia de BTC por romper el máximo histórico es notable, pero de momentos no lo ha logrado.
Hay demasiadas noticias fundamentales allí afuera que prácticamente están incentivando al BTC a seguir su camino alcista por un largo tiempo, pero creo que todos los que somos traders sabemos que un alza sin sus debidas correcciones no es saludable.
Velas de 1 día
Como podemos observar, el BTC se ha encontrado en una canal alcista visible en velas diarias, lo ha respetado perfectamente hasta ahora. Sin embargo se observa una debilidad del precio en la zona del máximo histórico en 61700$.
En este momento el BTC se encuentra en un punto bastante decisivo, ya que se está encerrando entre la resistencia clave y la linea de tendencia alcista del canal. En este punto solo quedan dos opciones, superar la resistencia y continuar su camino alcista, o romper el canal a la baja y corregir a zonas clave.
Velas de 1 día
En caso de una ruptura a la baja, podríamos ver una corrección del precio hasta los niveles de soporte en 45K$ y 40K$, que justamente calzan de manera perfecta con el .38 y .5 Fibonacci. Son niveles importantes y bastante fuertes.
Velas de 1 día
Creo que una corrección hasta estos puntos será muy saludable para BTC, además de que es un excelente punto de entrada para los hodlers. Serian dar un paso atrás para dar dos hacia adelante.
Personalmente me mantengo fuera del mercado en este momento. Estoy esperando la acción del precio para ver que rumbo toma el BTC en el corto plazo. Si corrige, probablemente compre en los puntos que he indicado, y si rompe al alza convincentemente, compraré con objetivos en 70K$ probablemente y un stop por debajo de los 58K$.
Espero esta información les sea de utilidad amigos traders. Las mejores de las probabilidades para ustedes 💪📈.
Descargo de responsabilidad
La información que se ofrece en este artículo es sólo mi análisis y opinión personal. Asegúrese de hacer su propio análisis e investigación. Operar con criptomonedas, divisas, materias primas, etc, es arriesgado.
Posted Using LeoFinance Beta
https://twitter.com/theanalystjohn/status/1381679293596631053
Congratulations @theanalystjohn! You have completed the following achievement on the Hive blockchain and have been rewarded with new badge(s) :
Your next target is to reach 600 comments.
Your next target is to reach 700 upvotes.
You can view your badges on your board and compare yourself to others in the Ranking
If you no longer want to receive notifications, reply to this comment with the word
STOPSupport the HiveBuzz project. Vote for our proposal!
Con eso estoy mas deacuerdo... a mi me sale muy parecido, 43.000$ un soporte y si lo pierde 35.000$ creo que es "EL SOPORTE"
Exactly, the $35K is like the last strongest support, it is one of the farthest points to where it can correct. In fact, too many buyers should come in much earlier to resume the rally.
Exacto, ya los 35K$ es como que el ultimo soporte mas fuerte, es de los puntos mas lejanos a donde puede corregir. De hecho mucho antes deberían entrar demasiados compradores que reanuden el rally.
Posted Using LeoFinance Beta