Crypto Analysis | BTC 38k - 48k Target?
Good day Hiveians!
Join me in analyzing the crypto markets!
While not official, crypto seems to be in a bull market once again
Last month I speculated that the bear was about to finish. In fact, I even asked this question as soon as in summer of 2022 and noted that bear markets often end around the new year. While I don't think anybody knows why this is the case, it seems like this time is no exception. Exactly in January the market has made a spectacular trend change and it seems that the bear could actually be behind us.
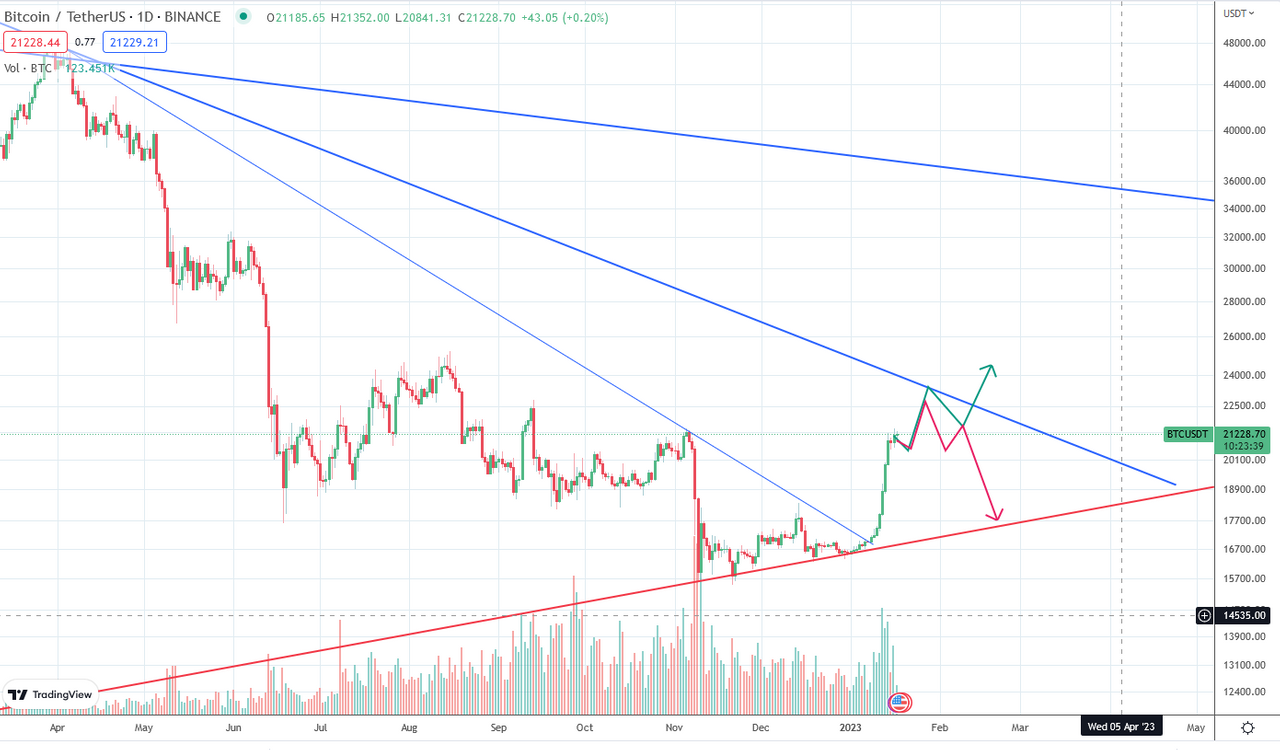
Back then I also made a chart which has aged quite well:

So far we are following the green path and in this post I also want to look at it a bit more in detail. As a caveat I still want to mention that the global geopolitical and economic situation is still very troublesome. If things should further escalate (and it basically already has with Russia-Ukraine), I think there could be some sort of black swan event that could crash the markets like it did during 2020 when Corona hit the world. Back then we saw a 50%+ correction in Bitcoin in like 2 days... So I think we would see something similar (fingers crossed that we won't!) Of course the markets would be the least of our problems depending on the news...
But we have had some renewed optimism, and the world really needs it!
So all things considered, where could Bitcoin be heading over the next months?
In a previous post, I gave this outlook:
Since price has broken upwards of the blue resistance, it seems we are still on track for the green impulse wave taking us further up.
There are quite a few trend lines in the following chart that need explanation as they all seem relevant. We have the blue ones that are support, the red ones that are resistances and dashed one that is a 10 year trend line that is acting as a resistance as well now.
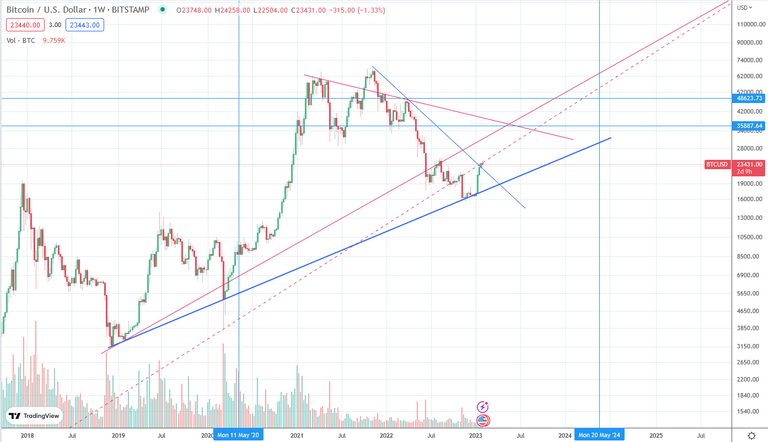
My premise is that Bitcoin will repeat a similar pattern like it die in 2019, which is that big movement from $3k to about $13k. There are two trend lines converging in summer of this year which will be a bigger resistance (if price can overcome the current dotted trend line). This area is at around 35k. But a fib retracement from the last ATH peak in 2018 suggests that price could go all the way to about 48k.
If it does follow along this pattern, I would expect it to look something like this:
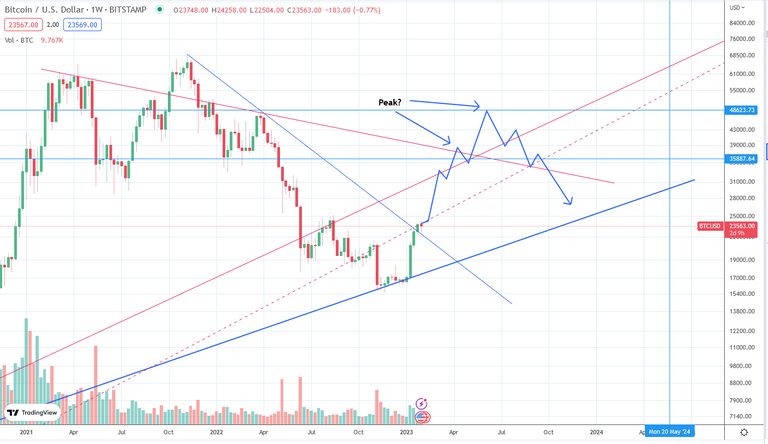
A peak would either form in spring at around 38k or in summer at around 48k. After that I would expect price to head down lower to perhaps meet the blue support line again. This could be at around 20k-25k! So beware :)
As a general reminder: Please keep in mind that none of this is official investment advice! Crypto trading entails a great deal of risk; never spend money that you can't afford to lose!


Check out the Love The Clouds Community if you share the love for clouds!
Great work. Nice one!!
Great post! We are thinking alike. 😊
Yea most likely if we reclaime 28k ish. Would also be max pain for those that diddent accumulate sub 20k hehe
Yes, timeline also suits. Looking for sell in may as last year and rebuy W bottom 20-25k as you mentioned.
Everything is currently working as expected. Like the last cycle it was worse, this time Its going good, I feel I have more control, less noob I guess hehe
1 Year of bear market has passed and we have seen some good projects getting collapsed like , luna,ftx and other, now if everything goes well, we can have 3 good years of Bull market. Can't be sure, but hopping for that.
🤞 I'll probably pray for this prediction!
!WINE
!PIZZA
Congratulations, @stdd You Successfully Shared 0.300 WINEX With @tobetada.
You Earned 0.300 WINEX As Curation Reward.
You Utilized 3/3 Successful Calls.
Contact Us : WINEX Token Discord Channel
WINEX Current Market Price : 0.126
Swap Your Hive <=> Swap.Hive With Industry Lowest Fee (0.1%) : Click This Link
Read Latest Updates Or Contact Us
I gifted $PIZZA slices here:
@stdd(7/10) tipped @tobetada (x1)
Please vote for pizza.witness!
All in all, it looks like the bear market is over and we're in a bull market. The way some good news is coming in the market now shows that the market may go higher in the coming days. The way you have created and shared the chart, I also feel that something similar will happen in the coming days. Thanks for sharing this great analysis with us.
Subimos, un gran trabajo
https://twitter.com/118886589/status/1621870639047901185
The rewards earned on this comment will go directly to the people( @sacra97 ) sharing the post on Twitter as long as they are registered with @poshtoken. Sign up at https://hiveposh.com.