Crypto Analysis | Hive: We Made Contact!
Good day Hiveians!
Join me in analyzing the crypto markets!
It's been 3 weeks since the last update to Hive
How time flies... Not too much has changed for Hive since then, especially in terms of the bigger picture except for one thing: Hive has again touched the support line established over one and a half years ago. Contact with this trend line has been in the making since July last year and I have learned (as I have seen this in many other coins as well) that price tends to come back down to the last established macro trend (as in the daily or weekly chart).
Last time I presented this chart which is still accurate: Hive has continued on its sideways movement and now briefly touched the bottom part of this channel.
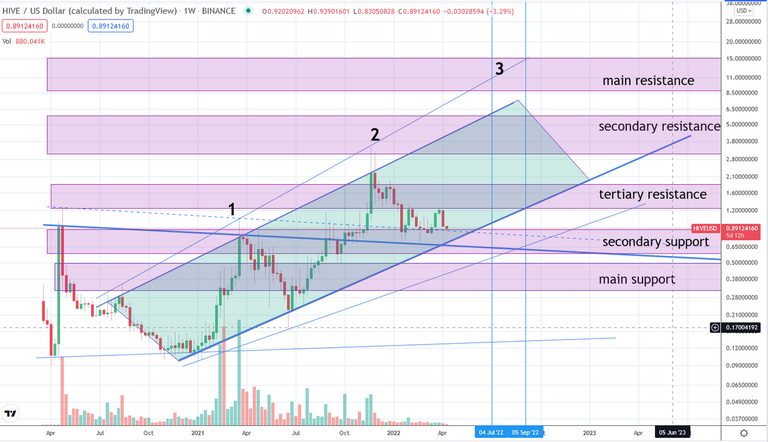
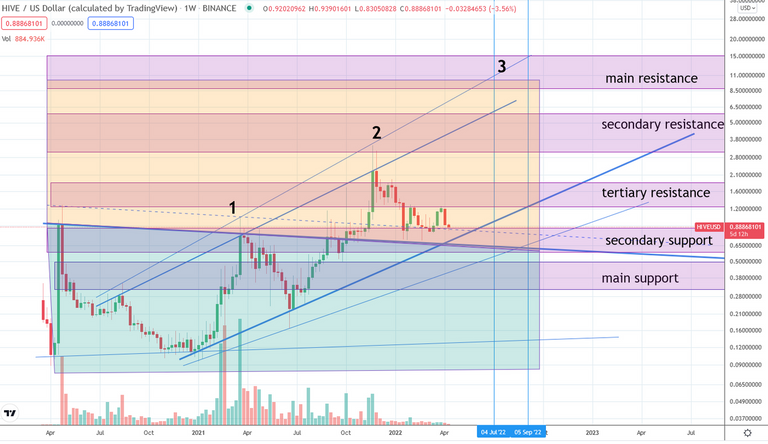
Will this be the trend reversal for Hive? Perhaps not, as there is another important chart which divides Hive horizontally into two segments. In October last year we breached upwards into the yellow area which was the brakeout of the established resistance coming from the former ATHs. Since then Hive remained above it and you can see that this support is slightly below the channel seen above. In other words, there is still room for further downward movement until about 60-65 cents.
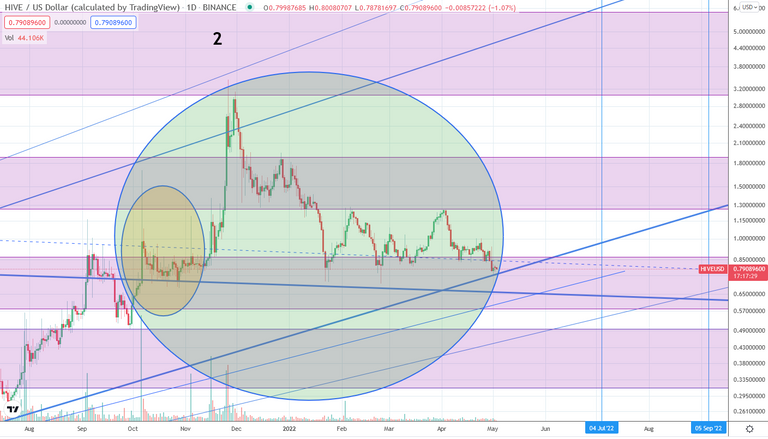
I think there is a good chance to revisit this area briefly. By that I mean a quick flash crash and a rebound so that there is only a wick on the weekly chart. Since Hive is already down 80% since its ATH of $3.4 I actually think that it is more likely that price will find support here rather than continue its downward trend. If so, we could perhaps see something that is visible in the movement leading up to the last ATH.
Take this fractal shown here in yellow. It is almost a perfect match in terms of shape to the larger one seen in green. We saw a huge spike and a crash and then a prolonged sideways movement.
Interestingly it would correspond to the already mentioned fractal shift seen several months ago. To me the bigger macro fractal in green seems like it would rather fit into the latter fractal shape.
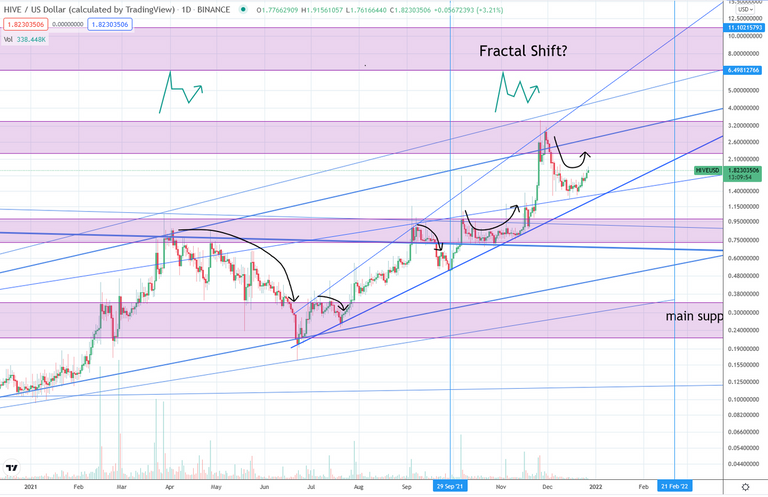
If so, we could potentially see something like this:
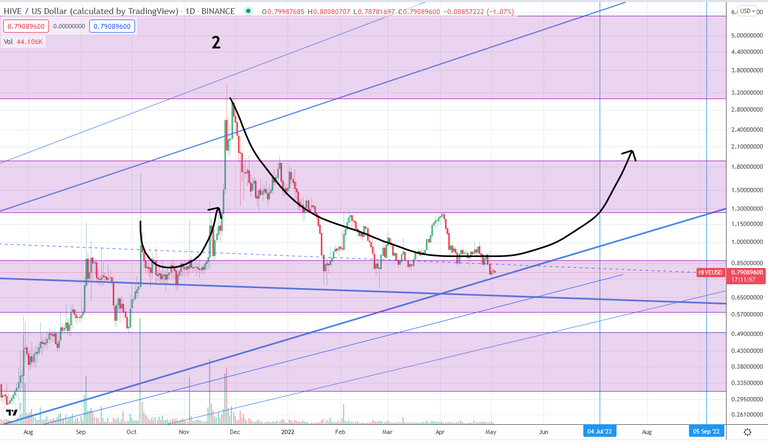
Keep in mind that there would be a lot of room for deviation from this crudely drawn path, but that the price on average should return to it. One last caveat: Hive is not having any big volume lately. Without it, I doubt we would see such an impulsive upward wave.
As a general reminder: Please keep in mind that none of this is official investment advice! Crypto trading entails a great deal of risk; never spend money that you can't afford to lose!


Check out the Love The Clouds Community if you share the love for clouds!
I am seeing Hive quite well these last weeks, I know that not much has changed but the community is still active and every day we see better posts.
These charts are a good predictor. Hive can still go down a bit. Perhaps should wait before buying. As you done these analysis a few times. And you are pretty accurate !