Crypto Analysis | KOIN Underperforming - But Not For Long?
Good day Hiveians!
Join me in analyzing the crypto markets!
Since last month KOIN has been underperforming
While the rest of the market had very good gains over the last few months, Koin went into the opposite direction. But I think there is a very obvious and simple explanation for that: lack of utility. The mainnet has only been running for several months and there are almost no dapps on the chain to speak of. We so far have only basic functionality: a wallet, a CEX listing, some NFTs etc. What this chain needs is many more dapps and many more developers because one glance at the whitepaper reveals that Koinos has massive potential. So far, like Hive, it has been mostly flying under the radar.
Last month we saw that Koin was "stuck in a wedge". The macro chart revealed that both support and resistance were coming to a close. Now we know that the resistance prevailed and the support has been broken:
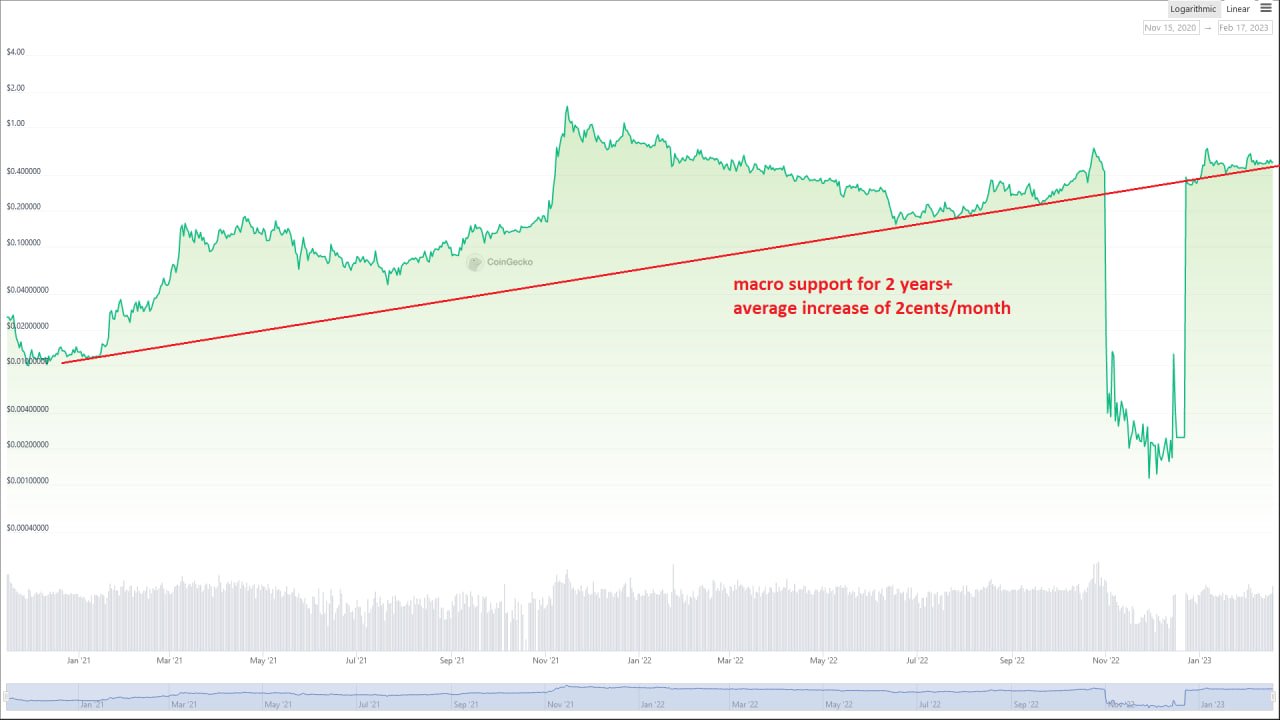
The updated chart looks like this:
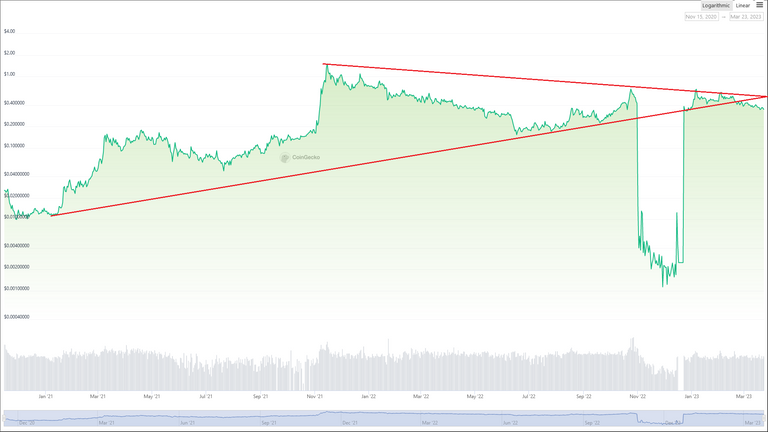
From a TA perspective this looks not so good: the macro support has been broken.
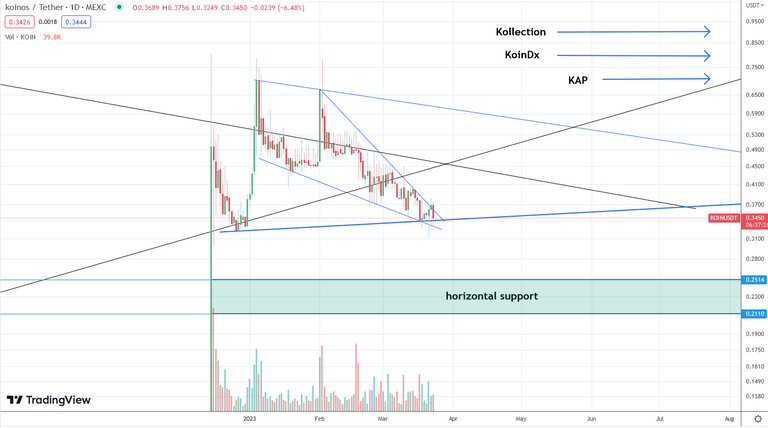
But let's zoom in as there is a lot more detail there. The next chart has a lot of info; let me break it down for you:
- the black trend lines are the macro trend lines form the chart above
- the blue lines are from the daily chart showing the new sideways wedge as well as the falling wedge
- there is some horizontal support from the historic price chart at around 20+ cents
- there are several dapps soon to be released with the approximate time frame
Since March price has broken under the macro support and has established a falling wedge. Generally speaking price often breaks out to the upside when stuck in a falling wedge. So there is a bit of upward potential there. The bottom support (blue trend line) has not been established and is rather weak. So the price could still fall, perhaps until the horizontal support. But one has to remember that 30 cents+ is already a very "oversold" price since Koin has been trading at over $1 some years ago.
The Koin chart is quite unique in that it is one of the few coins that has a pre-mainnet chart on a different chain (Eth) as well as a current chart on it's own blockchain. We therefore have a situation in which we have historical price data that has to be taken with a grain of salt. It is less "deterministic" as other price charts that haven't seen such a dramatic shift. What I think we will be seeing is that the historical data will still carry some weight, but will probably be weaker than the current price action. In other words, if we take e.g. the blue trend lines in the chart, they should be more important in TA than the black macro trend lines.
One thing is clear: in the coming months there will be many new dalls released which will actually give this blockchain utility. Kollection is coming as a marketplace for NFTs; KoinDx is coming as a defi platform; and KAP is coming which will act as the Koinos account protocol. Alone these three dapps should make this blockchain quite attractive, and of course they are just a start to a much wider ecosystem.
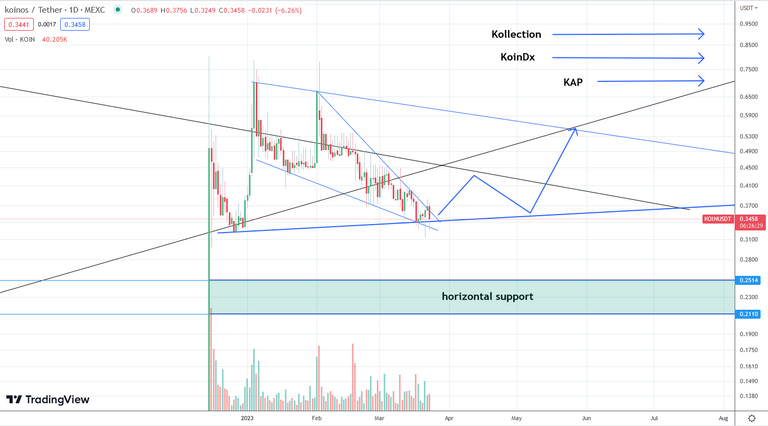
For these reasons I am more optimistic and think we could see Koin move in more consolidation and eventually to the upside.
As a general reminder: Please keep in mind that none of this is official investment advice! Crypto trading entails a great deal of risk; never spend money that you can't afford to lose!


Check out the Love The Clouds Community if you share the love for clouds!
I love your style of analysis
thank you :))
My pleasure
I love your trading analysis, you understand things very deeply us. I have spent so many times that what you have said has proven to be true .
happy to see that it can help :)
Thanks it's much for me😁
@tipu curate
Upvoted 👌 (Mana: 33/43) Liquid rewards.