ZOOM OUT AND ZOOM IN
(Edited)
In bearish moments at HIVE, it is always good to take a look at the compound interest graph planned according to my natural growth strategy...today is one of those days...
ZOOM OUT
The long term graph:
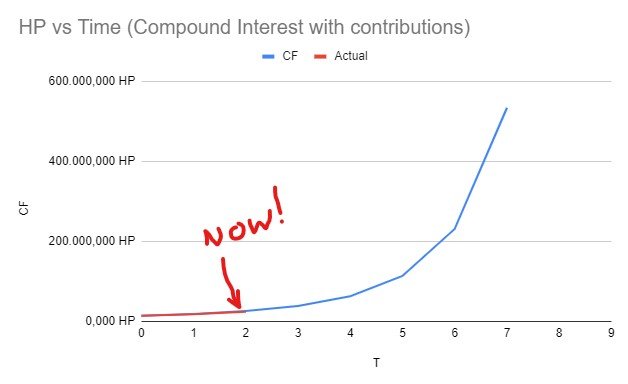
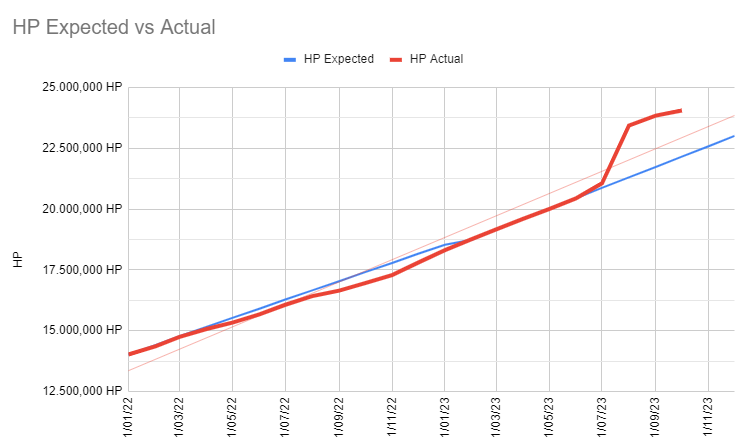
ZOOM IN
The same graph with a smaller timeframe, only year 2 (current), the blue line is the path of the compound interest calculated a couple of years ago... the red line is the current situation.
In the end, it's all about having a good perspective.
Have a great week!
@toofasteddie
Posted Using LeoFinance Alpha
Posted Using LeoFinance Alpha
0
0
0.000
It keeps coming in with time. Keep up the good work by not giving up.
Never
I like your perspective into the chart, seeing how your chart clearly stated it. I agree with you on the long term zoom in and out as the bearish market takes precedence.
What is T? CF?
Time, compounding final
Success in this way can only come to a person by working hard and never stop working, the way we see you working hard for a long time and succeeding.
Congratulations @toofasteddie! You have completed the following achievement on the Hive blockchain And have been rewarded with New badge(s)
You can view your badges on your board and compare yourself to others in the Ranking
If you no longer want to receive notifications, reply to this comment with the word
STOPCheck out our last posts:
Thanks for sharing this view.
I like both charts and it all adds up over time. Hive is great because we can grow our own stake by being active here.
https://twitter.com/LovingGirlHive/status/1703656004934906227
https://twitter.com/lee19389/status/1703779621408264599
#hive #posh