BTCUSD position: Day 33 of 100DAYSOFTA
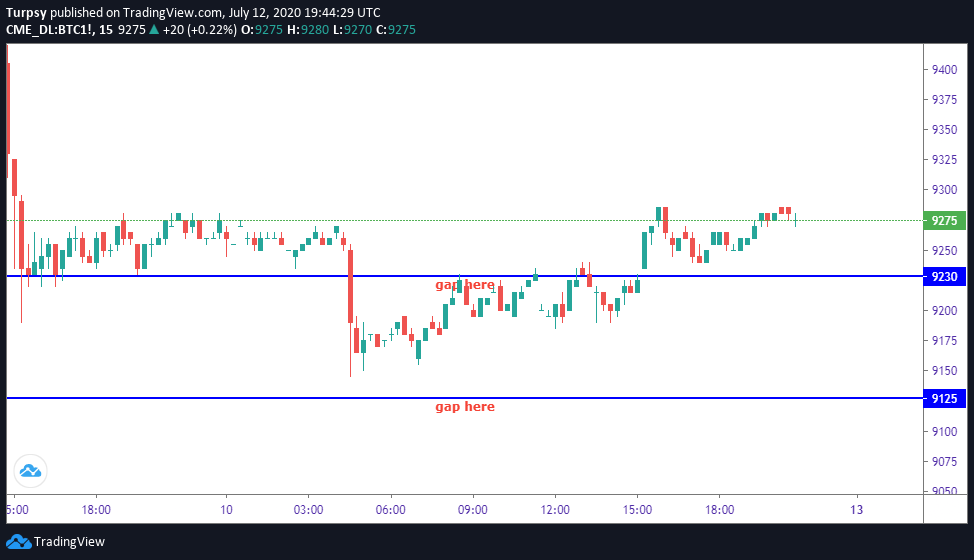
In some few hours time, the CME market will open and we can see the price action on this chart. We have gaps at gaps at 9125, 9230 and 9600 USD. We have the probability to go up or down.
We should also know that CME chart is something that cannot be ignored.
https://www.tradingview.com/x/lKdAfPwo/
This is my entry for the 100DAYSOFTA challenge, Sunday 12th July 2020.
__
I am joining a challenge by a group of traders. The challenge is #100DAYSOFTA. Some of the people in this group have posted on $Youtube, $Twitter but I will be posting mine on Hive.
The convener of this challenge is https://twitter.com/CryptoluXP
However, the frequency might not be daily but it will be sequential.
Having said that, here is what I have:
__
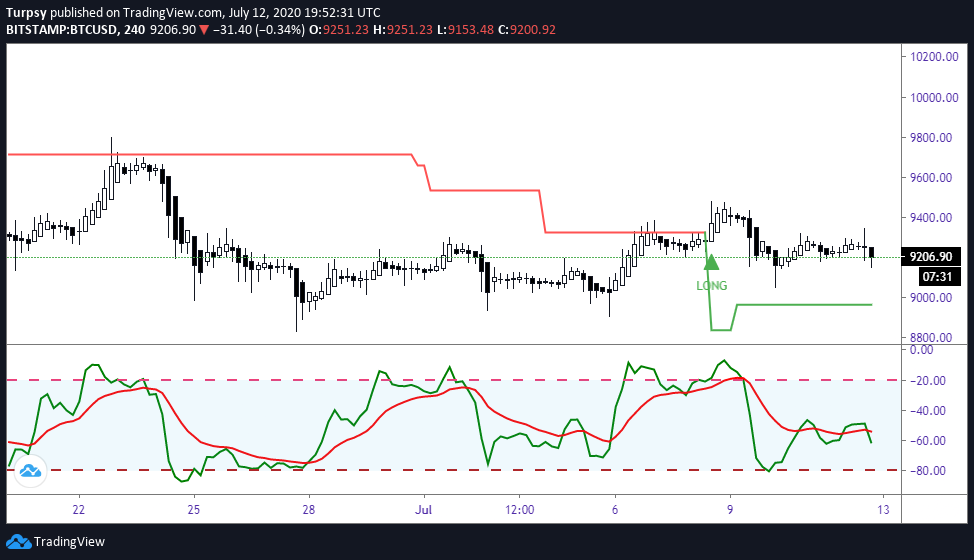
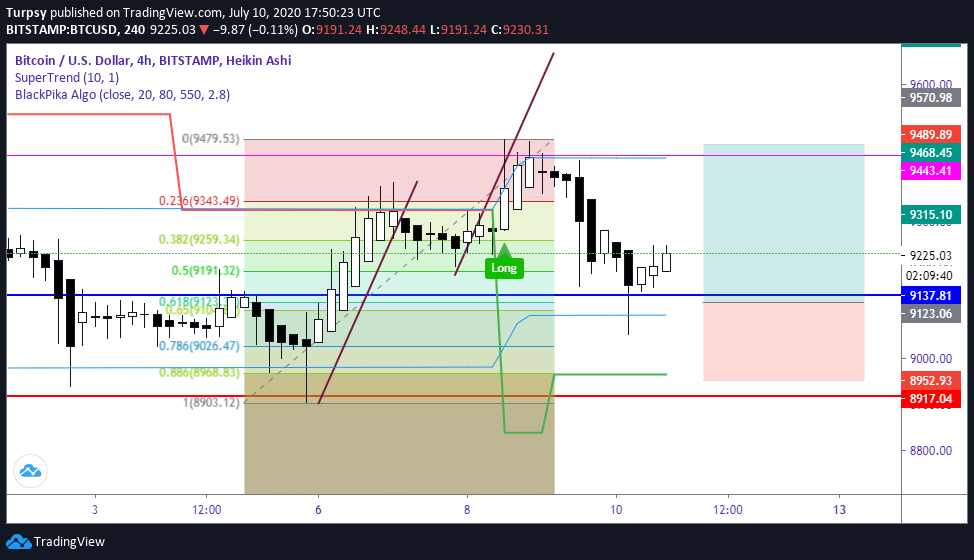
4 hr
One way that SYT helps is that it reduces the ways we look at the chart and help to narrow our conclusion, so that when we are wrong following the ST indicator, guilt will not be gift. The ST on this TF is long, and I am leaning more to be long. It is therefore to be done in conjunction with Willy. Willy is crappy right now and no clear direction on it. However, I think a drop might be great, so we are very likely to have a price nose diving again soon, so we can have Willy oversold and then it can go up again.
https://www.tradingview.com/x/A35DhjnG/
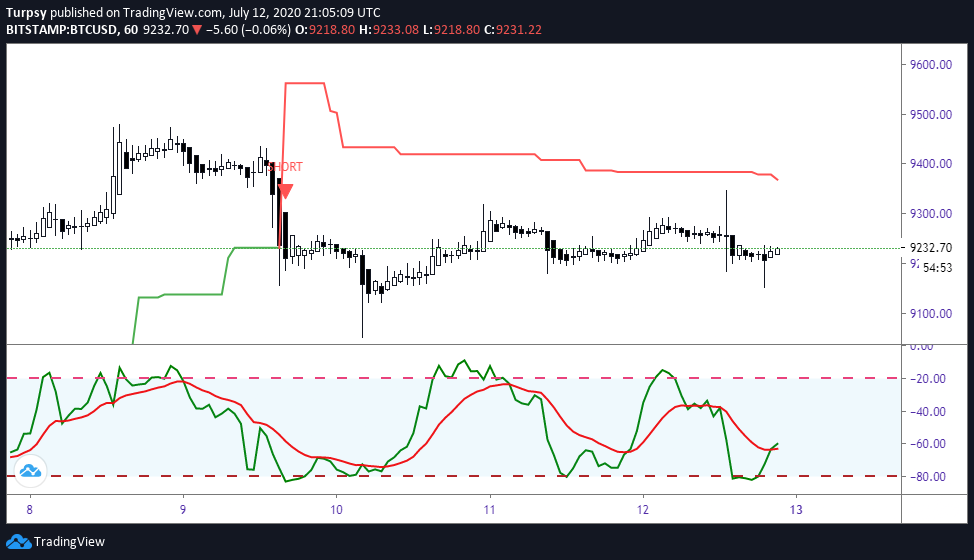
1h
To be logical and rational, focusing on the indicators and timeframes helps a lot. The ST is short on this TF, and that means we should look for a trade that follows the indicator. Willy is also at oversold and its trending upwards again. This may mean we can expect the price to trend upwards before a fall.
https://www.tradingview.com/x/UxicHfUg/
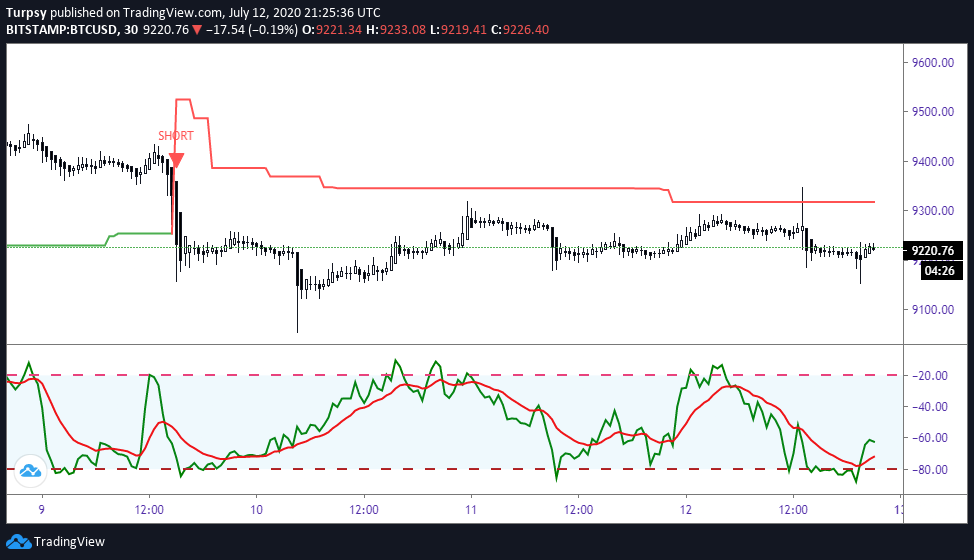
30 mins
The ST is showing that we should be short on this timeframe. Also we have been seeing prices reacting and moving downward. Willy is already at the oversold and we may have a nice price reaction upwards, maybe toward the resistance at around 9350 USD. The thing we also need to note is that we may have a price action that is based on weekend volatility.
https://www.tradingview.com/x/fNxXV1ed/
Extras
15mins and 5 mins charts respectively.
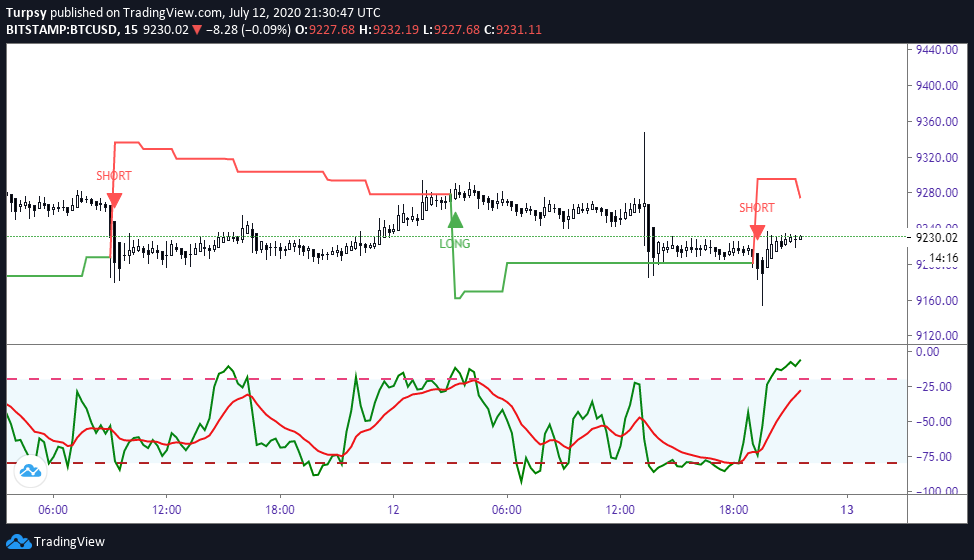
https://www.tradingview.com/x/CXB6cjbn/
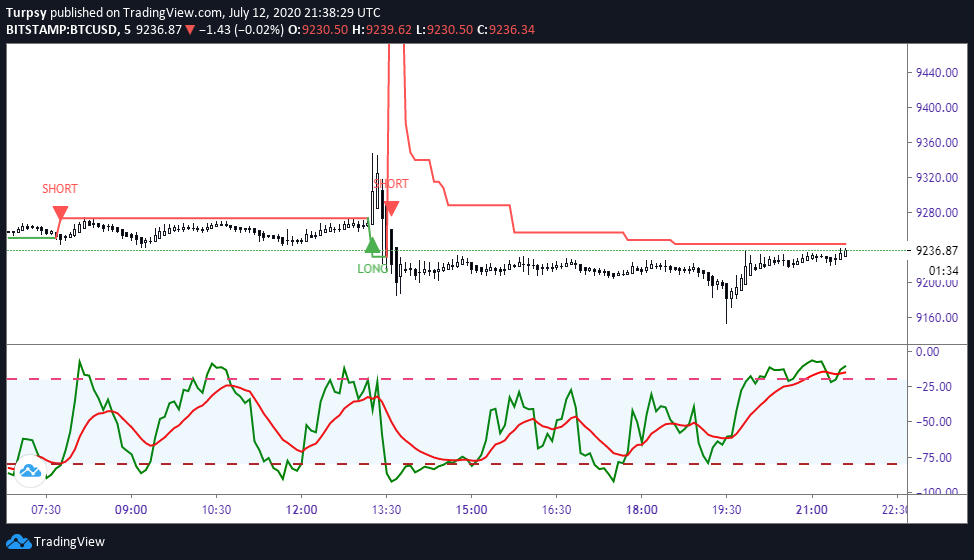
https://www.tradingview.com/x/cn9K3IQ0/
Summary:
4hrs ST is long
1hr ST is short
30 mins ST is short
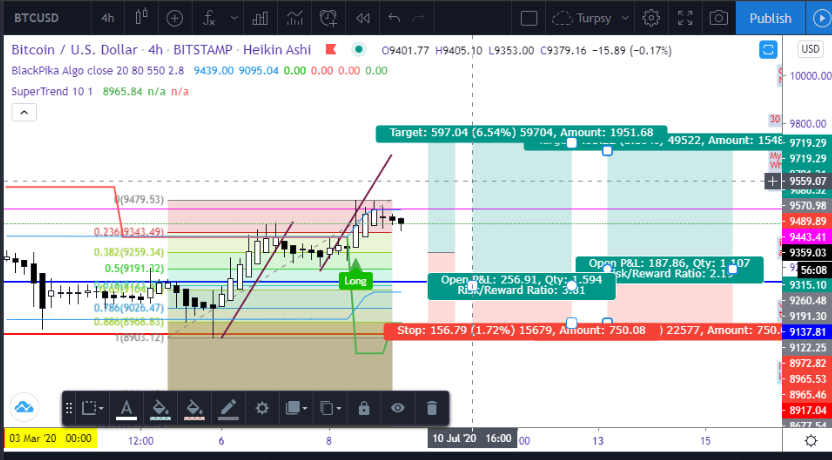
My Position
We are already in a position. Please see below.
https://www.tradingview.com/x/tXnTXm4t/
Please see the text below for the entries.
Today, it has flipped long. That means I have to look for a long opportunity at any drop. I will be longing.
This long entry will be at 0.382, 0.5 and 0.618 Fibonnaci retracements numbers, stop loss at 0.886, Target at 9700+.
Congratulations @turpsy! You have completed the following achievement on the Hive blockchain and have been rewarded with new badge(s) :
You can view your badges on your board And compare to others on the Ranking
If you no longer want to receive notifications, reply to this comment with the word
STOPDo not miss the last post from @hivebuzz:
Support the HiveBuzz project. Vote for our proposal!