BTCUSD position Day 41 of 100DAYSOFTA
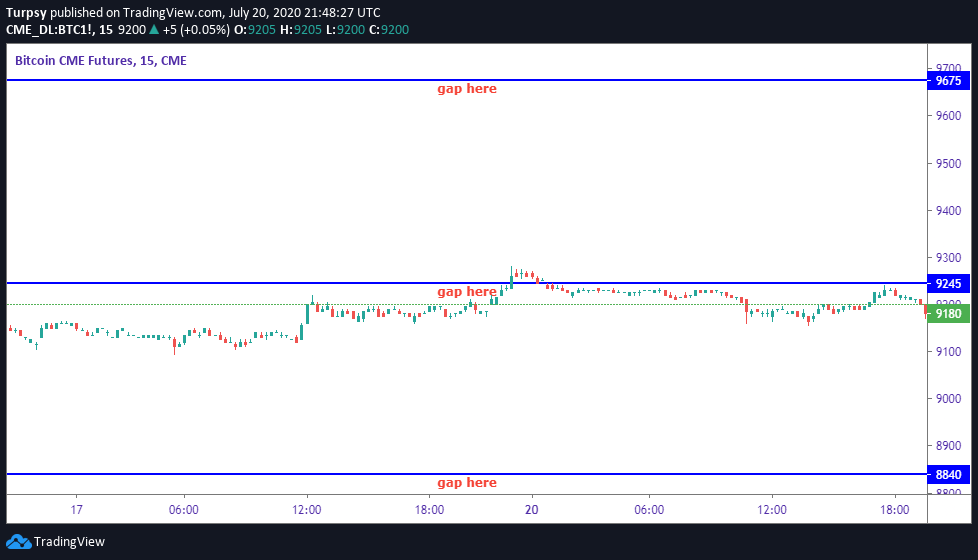
9245 USD region has got to be the most dreaded region in the past few weeks. Prices have been hovering around this region and gaps have been created and closed several times here too. We also have a new gap there. It will be filled, but the question is when?
https://www.tradingview.com/x/6cTFfcXX/
This is my entry for the 100DAYSOFTA challenge, Monday 20th July 2020.
__
I am joining a challenge by a group of traders. The challenge is #100DAYSOFTA. Some of the people in this group have posted on $Youtube, $Twitter but I will be posting mine on Hive.
The convener of this challenge is https://twitter.com/CryptoluXP
However, the frequency might not be daily but it will be sequential.
Having said that, here is what I have:
__
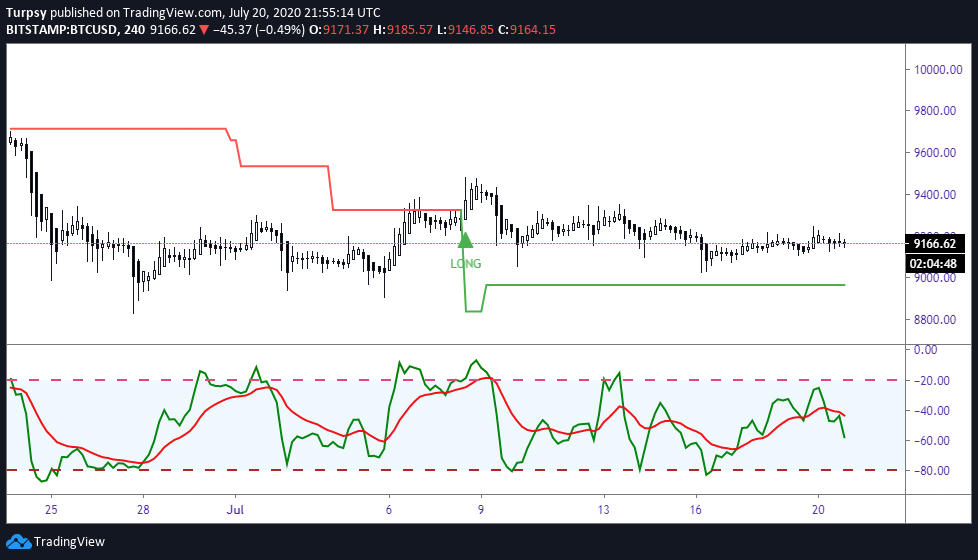
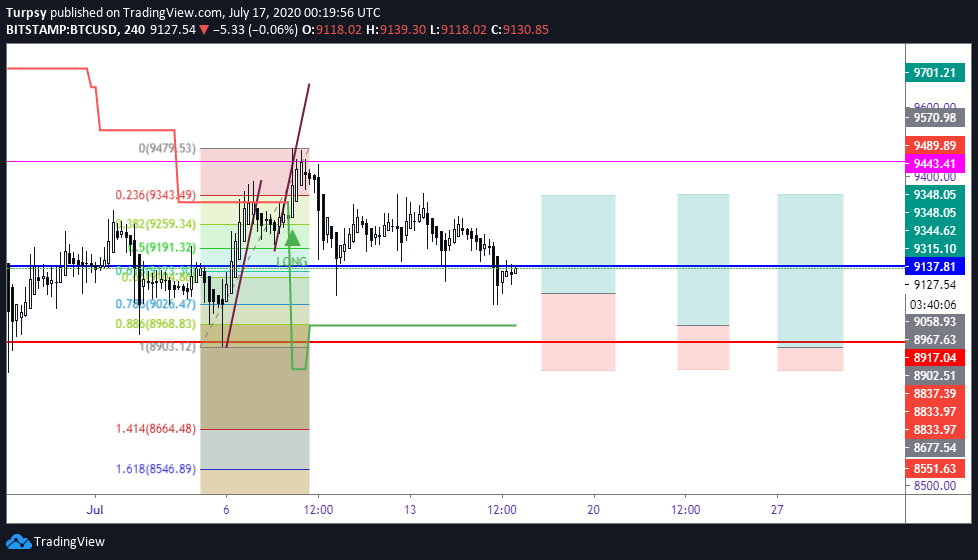
4 hr
We are having a Willy showing a bearish turn. But ST is still long. This is somewhat bullish and bearish. The bearish is that Willy needs to be oversold before we can look for a long. Also, the ST long is the bullish part, meaning we can be confident in a long position unless 8960 USD support gets broken and shattered. Price has been in a range in the past days. We hope to see the right movement soon.
https://www.tradingview.com/x/0HcruehB/
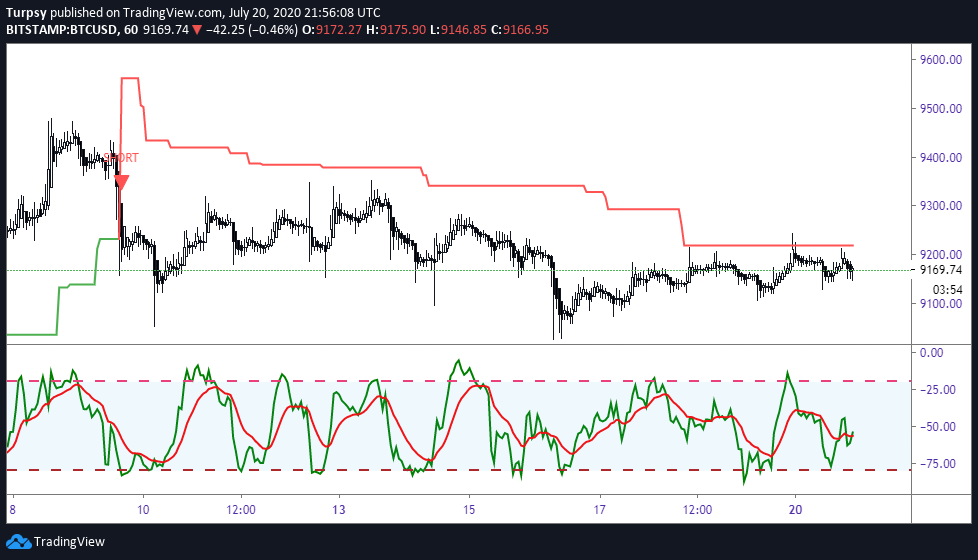
1h
On this TF, we already had almost triple tops, with price getting rejected at around 9210 USD. This shows we are either going to break it hard or we are going to dump pretty hard. Any of the scenarios is possible. However, when prices hit the resistance several times, there is possibility to break it. But to be technical, we can short at the resistance and put stoploss above, as I suggested yesterday. Willy is not clear, but looks to be trending upwards.
https://www.tradingview.com/x/wxfh9yU4/
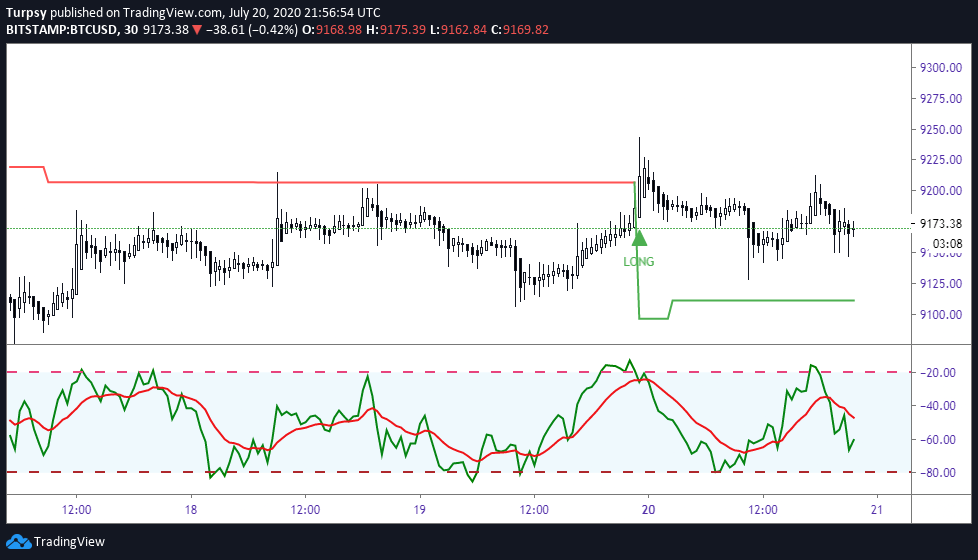
30 mins
ST is long and and we can expect a dump to 9110 USD as support. If we do not break the support and close below it, then we can possibly long the corn. Also, WIlly is now trending downwards, suggesting we can expect a dump or sideways action till we are oversold on the Willy. This is a point at which we can look for a long.
https://www.tradingview.com/x/lIbOU1Bv/
Extras
15mins and 5 mins charts respectively.
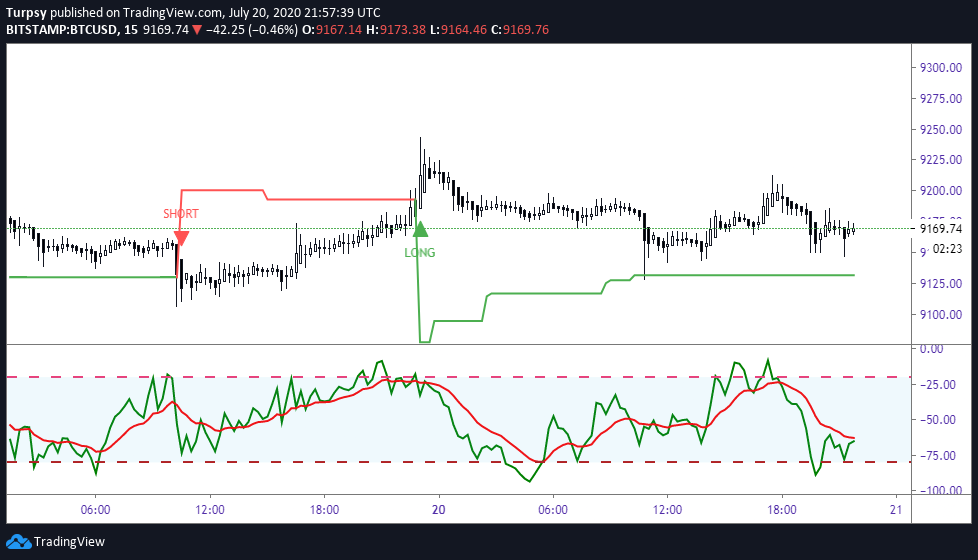
https://www.tradingview.com/x/TxWUgr2N/
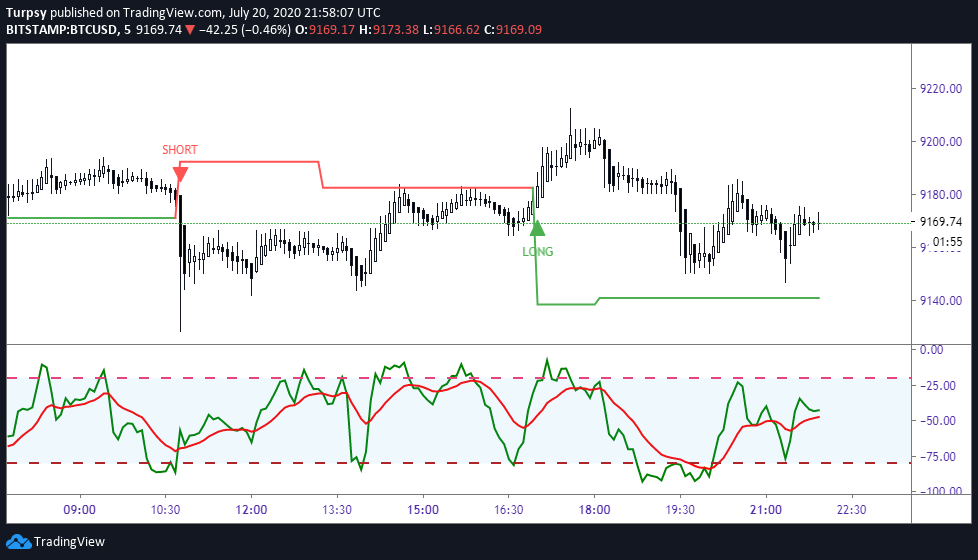
https://www.tradingview.com/x/Iz3ZuWj3/
Summary:
4hrs ST is long
1hr ST is short
30 mins ST is long
My Position
This week we may have a breakout, a breakdown or back to the range after wicks.
I exited my position yesterday since I am not too confident in Thursday price action. Now, I will re-assess the charts to choose another entry.
https://www.tradingview.com/x/RxflqFmg/
Those are my new entry and plan. I hope it works out well. It may not all fill, since I am more conservative in this trade.