Introduction to Ultimate Oscillator Indicator
The term Ultimate Oscillator Indicator was developed far backed in 1976 by Larry Williams, as an attempts to correct trading with more than one timeframe with the help of using three (3) different time frames such as 7 shorter, 14 medium, and 28 long term market trends.
Having said that, Ultimate Oscillator Indicator is simply a technical indicator that is used by both crypto and forex traders to measure the price momentum of an asset (digital assets) across different timeframe. By my usage of this indicator when trying to know the price momentum of the asset I am trading, I can say that it is a good indicator that can help you to identified Buying Signal and Selling Signal. Let's take a look at how you can be able to identify this two signal...
Buying Signal:
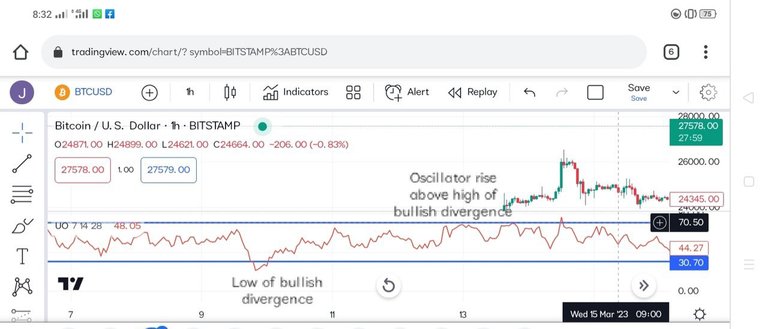
screenshot gotten from Tradingview
In a buying signal you will see a bullish divergence occur which is an indication that the price of the asset has made a lower low that isn't yet confirmed by the Oscillator lower low.
Secondly, at this stage of bullish divergence, you will see how the low of the Oscillator Indicator line has falls below 30 line.
Thirdly, as the Oscillator falls below 30line, the Oscillator will then rise above the highest point reached during the time of the bullish divergence.
Selling signal:

screenshot gotten from Tradingview
In a selling signal you will see a bearish Divergence occur which is an indication that the price of the asset will make a higher high that isn't yet confirmed by the Oscillator higher high.
Secondly, at this stage of bearish Divergence, you will see how the high of the Oscillator Indicator has rises above 70 lines.
Thirdly, as the Oscillator rises above the 70 line, the Oscillator will then fall below the lowest point reached during the of the bearish Divergence.
How to calculate ultimate oscillator Indicator..
In order for you to be able to calculate ultimate oscillator indicator value for a certain timeframe, or candle, you will have to understand that oscillator indicator have 3 major steps when calculating for any certain timeframe or candlestick.
As earlier introduced, ultimate oscillator indicator have the following timeframe (7,14, and 28).
Step 1: Define your two variables: Buying pressure and True Range. In doing this, the below formula will assist you.
Buying Pressure (BP) = Current Close – Minimum (Current Low or Previous Close).
True Range (TR) = Maximum (Current High or Previous Close) – Minimum (Current Low or Previous Close)
Step 2: The Step1 figure will then be use by ultimate oscillator to calculate the 3 timeframe.
A7 = (7 P BP Sum) / (7 P TR Sum)
A14 = (14 P BP Sum) / (14 P TR Sum)
A28 = (28 P BP Sum) / (28 P TR Sum)
Where:
A7 = Average7
A14 = Average 14
A28 = Average 28
7 P = 7 days Period
28 P = 28 days Period
BP = Buying Pressure
TR = True Range
Step 3: At this step, you will now, calculate your Ultimate Oscillator using the below formula.
Ultimate Oscillator (UO) = 100 × [(4 × A7) + (2 × A14) + A28] / (4 + 2 + 1)
Conclusion
Ultimate oscillator Indicator is a very nice indicator that can help you to know the timeframe that is higher or shorter since it makes uses of different periods. In this post, we have been able to understand Ultimate Oscillator Indicator.
Congratulations @vialacrypto! You have completed the following achievement on the Hive blockchain And have been rewarded with New badge(s)
Your next target is to reach 20 posts.
You can view your badges on your board and compare yourself to others in the Ranking
If you no longer want to receive notifications, reply to this comment with the word
STOPTo support your work, I also upvoted your post!
Check out our last posts:
Support the HiveBuzz project. Vote for our proposal!