Introduction to Ultimate Oscillator Indicator
The term Ultimate Oscillator Indicator was developed far backed in 1976 by Larry Williams, as an attempts to correct trading with more than one timeframe with the help of using three (3) different time frames such as 7 shorter, 14 medium, and 28 long term market trends.
Having said that, Ultimate Oscillator Indicator is simply a technical indicator that is used by both crypto and forex traders to measure the price momentum of an asset (digital assets) across different timeframe. By my usage of this indicator when trying to know the price momentum of the asset I am trading, I can say that it is a good indicator that can help you to identified Buying Signal and Selling Signal. Let's take a look at how you can be able to identify this two signal...
Buying Signal:
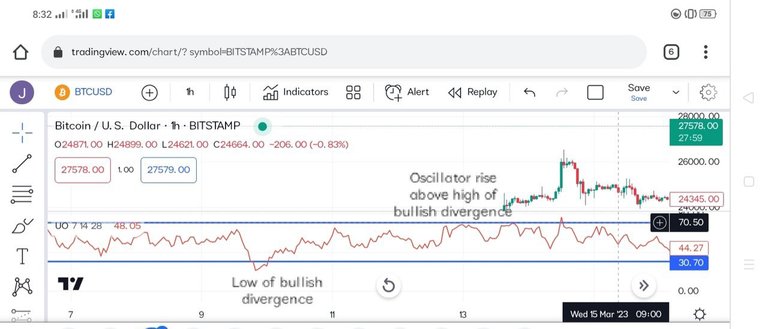
screenshot gotten from Tradingview
In a buying signal you will see a bullish divergence occur which is an indication that the price of the asset has made a lower low that isn't yet confirmed by the Oscillator lower low.
Secondly, at this stage of bullish divergence, you will see how the low of the Oscillator Indicator line has falls below 30 line.
Thirdly, as the Oscillator falls below 30line, the Oscillator will then rise above the highest point reached during the time of the bullish divergence.
Selling signal:

screenshot gotten from Tradingview
In a selling signal you will see a bearish Divergence occur which is an indication that the price of the asset will make a higher high that isn't yet confirmed by the Oscillator higher high.
Secondly, at this stage of bearish Divergence, you will see how the high of the Oscillator Indicator has rises above 70 lines.
Thirdly, as the Oscillator rises above the 70 line, the Oscillator will then fall below the lowest point reached during the of the bearish Divergence.